NZD/USD Price Analysis: Bulls struggle to hold gains, Kiwi outlook turns negative

Source Fxstreet
  • Kiwi tallies a three-day losing streak, end the week on a negative note with the pair stabilizing at 0.6115.
  • NZD/USD outlook continues to skew bearish as bulls fail to maintain upward traction.
  • Bucking the bearish trend, a break above 0.6150, the position of the 20-day SMA, is vital.

On Friday, the NZD/USD extended its losing streak to three days. Despite an attempt to rally which took the pair to a high of 0.6140, the bulls were unable to return to the positive side and the pair stabilized at 0.6115 The unsuccessful attempt to maintain gains solidifies the increasing bearish sentiment for the Kiwi. The currency pair must climb past the 20-day Simple Moving Average (SMA) situated at 0.6150 to brighten the otherwise negative outlook.

The Relative Strength Index (RSI) for the NZD/USD pair on the daily chart locates at 49, hinting at a shift of momentum towards more bearishness. Despite this downward shift, the RSI remains near the neutral zone. Furthermore, the Moving Average Convergence Divergence (MACD) continues to increase its red bars, indicating an amplified seller presence in the market.

NZD/USD daily chart
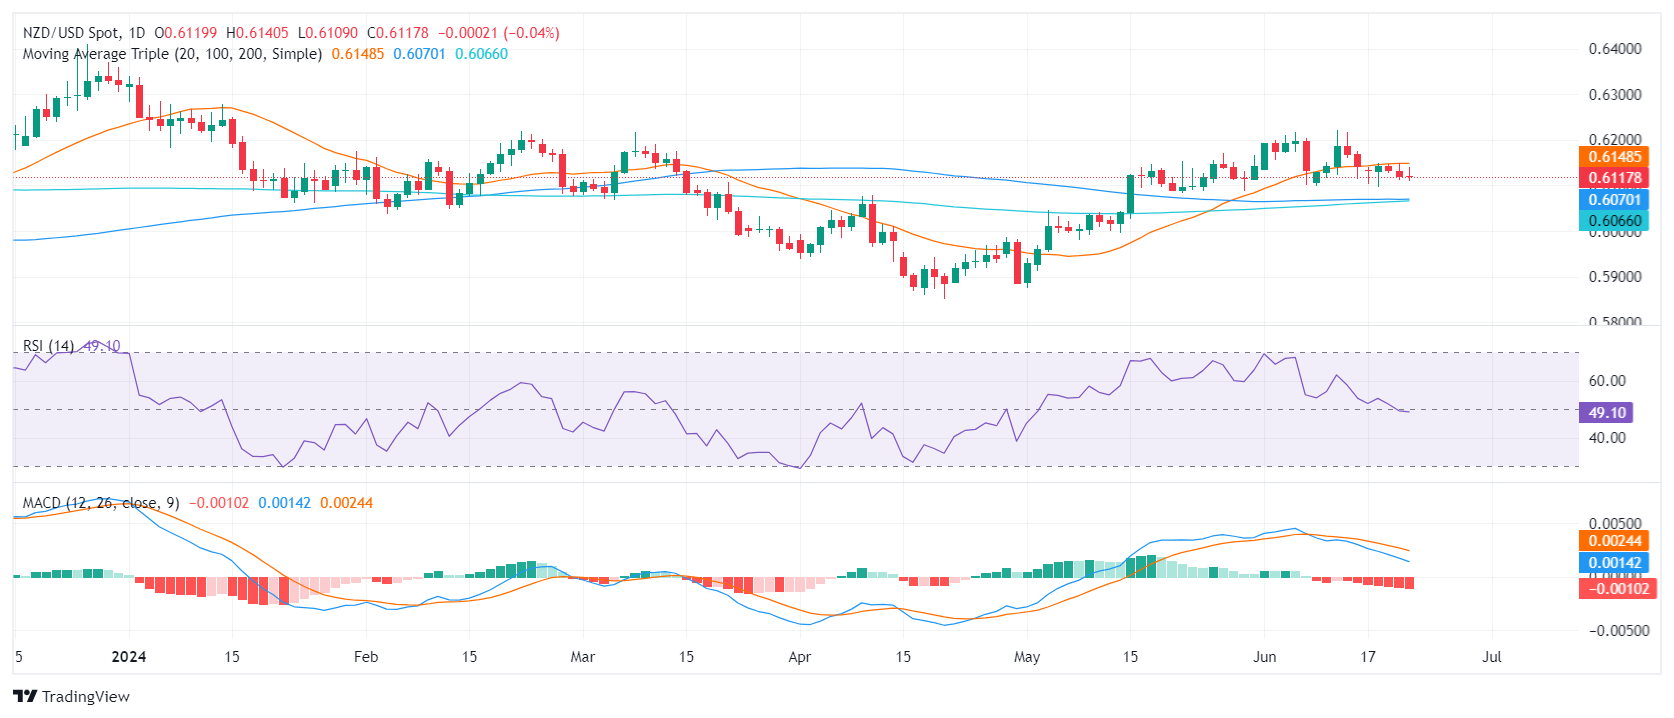
The NZD/USD finds immediate support near the 0.6100 level. Beneath that, additional support resides at the 100-day SMA at 0.6070 and the 200-day SMA at 0.6060. These levels could offer a robust defense should the pair extend its downside. A breach below these SMA convergence points might signal an intensifying sell-off scenario.

Conversely, the first resistance remains around the 20-day SMA level at 0.6150. Higher resistances are found at the 0.6170 and 0.6200 levels. A decisive breakout above these levels could possibly indicate an end to the current bearish market sentiment and start to favor the bulls.


NZD/USD

Overview
Today last price 0.6118
Today Daily Change -0.0002
Today Daily Change % -0.03
Today daily open 0.612
 
Trends
Daily SMA20 0.6148
Daily SMA50 0.6055
Daily SMA100 0.607
Daily SMA200 0.6065
 
Levels
Previous Daily High 0.6149
Previous Daily Low 0.6111
Previous Weekly High 0.6222
Previous Weekly Low 0.6099
Previous Monthly High 0.6171
Previous Monthly Low 0.5875
Daily Fibonacci 38.2% 0.6126
Daily Fibonacci 61.8% 0.6134
Daily Pivot Point S1 0.6104
Daily Pivot Point S2 0.6089
Daily Pivot Point S3 0.6066
Daily Pivot Point R1 0.6142
Daily Pivot Point R2 0.6165
Daily Pivot Point R3 0.618


Disclaimer: For information purposes only. Past performance is not indicative of future results.
placeholder
EURUSD Long-term Forecast: Can ECB Hawks Overcome the Dollar Bullishness? As one of the most traded currency pair in the forex markets, the price of EURUSD affects many traders. Check out our EURUSD long-term forecast for more information.
Author  Mitrade
Mar 13, 2023
As one of the most traded currency pair in the forex markets, the price of EURUSD affects many traders. Check out our EURUSD long-term forecast for more information.
placeholder
Copper Long-term forecast: Will Copper Price Expected To Soar In 2023?The price of copper is affected by various of factors. You may wonder how the price of cooper will be in 2023, check out our forecast analysis.
Author  Mitrade
Mar 13, 2023
The price of copper is affected by various of factors. You may wonder how the price of cooper will be in 2023, check out our forecast analysis.
placeholder
Bitcoin CME gaps at $35,000, $27,000 and $21,000, which one gets filled first?Prioritize filling the $27,000 gap and even try higher.
Author  FXStreet
Aug 21, 2023
Prioritize filling the $27,000 gap and even try higher.
placeholder
Natural Gas sinks to pivotal level as China’s demand slumpsNatural Gas price (XNG/USD) edges lower and sinks to $2.56 on Monday, extending its losing streak for the fifth day in a row. The move comes on the back of China cutting its Liquified Natural Gas (LNG) imports after prices rose above $3.0 in June. It
Author  FXStreet
Jul 01, Mon
Natural Gas price (XNG/USD) edges lower and sinks to $2.56 on Monday, extending its losing streak for the fifth day in a row. The move comes on the back of China cutting its Liquified Natural Gas (LNG) imports after prices rose above $3.0 in June. It
placeholder
Weekly Market Outlook: Tesla Kicks Off Big Tech Earnings; U.S. Election Enters Final StretchTradingKey – This week, key economic data includes U.S. September durable goods orders, the University of Michigan’s October Consumer Sentiment Index, and preliminary PMI data from several countries,
Author  Mitrade
22 hours ago
TradingKey – This week, key economic data includes U.S. September durable goods orders, the University of Michigan’s October Consumer Sentiment Index, and preliminary PMI data from several countries,
Related Instrument
goTop
quote