NZD/JPY Price Analysis: Cross extends gains to multi-year highs past 97.50

Source Fxstreet
  • The cross continued its upward journey, reaching new cycle highs above 97.50, levels not seen since July 2007.
  • The daily chart shows intense bullish sentiment, with the Yen weakening against its peers.
  • Indicators are approaching overbought conditions which might limit the upside.

On Friday, the NZD/JPY cross extended advances and established multi-year highs above  97.50. The 20-day Simple Moving Average (SMA), now at 96.60 continued as firm support at the beginning of the week, where buyers ward off sellers' strivings to breach this level.

The daily Relative Strength Index (RSI) for NZD/JPY is currently at 68, indicating an increase from Thursday's value and overall upward momentum. Meanwhile, the Moving Average Convergence Divergence (MACD) for today shows decreasing red bars, implying decreased selling pressure. The RSI near 70 should flash caution to investors as it approaches the overbought threshold.

NZD/JPY daily chart
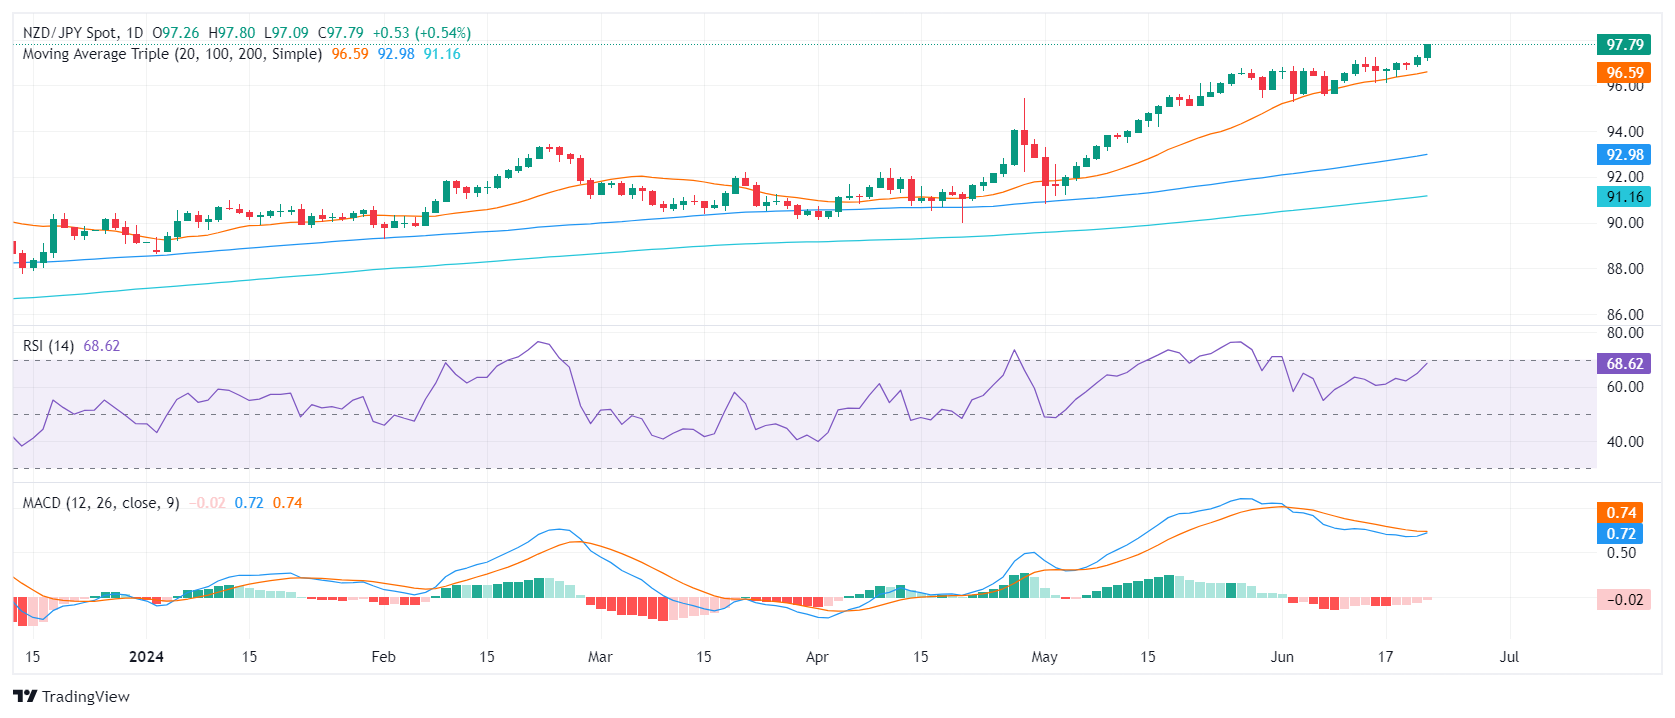
The bulls' tenacity to sustain their positions above the 20-day SMA remains unshaken. This, combined with the near-overbought daily technical indicators, reinforces the superior technical vim of the Kiwi against the Yen. The consecutive failed attempts from the sellers to breach the 96.30 point, a strong support, led to the bulls' momentum which catalyzed the surge to fresh highs.

For the following trading sessions, the cross may oscillate between the immediate support at 97.00 and the resistance target at 98.00. Investors need to keep an eye on a possible break above the mentioned range or a fall below the 20-day SMA mark which could signal a deeper correction.


NZD/JPY

Overview
Today last price 97.78
Today Daily Change 0.52
Today Daily Change % 0.53
Today daily open 97.26
 
Trends
Daily SMA20 96.5
Daily SMA50 94.45
Daily SMA100 92.9
Daily SMA200 91.11
 
Levels
Previous Daily High 97.31
Previous Daily Low 96.82
Previous Weekly High 97.25
Previous Weekly Low 95.62
Previous Monthly High 96.74
Previous Monthly Low 90.83
Daily Fibonacci 38.2% 97.12
Daily Fibonacci 61.8% 97.01
Daily Pivot Point S1 96.94
Daily Pivot Point S2 96.64
Daily Pivot Point S3 96.45
Daily Pivot Point R1 97.44
Daily Pivot Point R2 97.62
Daily Pivot Point R3 97.93


Disclaimer: For information purposes only. Past performance is not indicative of future results.
placeholder
EURUSD Long-term Forecast: Can ECB Hawks Overcome the Dollar Bullishness? As one of the most traded currency pair in the forex markets, the price of EURUSD affects many traders. Check out our EURUSD long-term forecast for more information.
Author  Mitrade
Mar 13, 2023
As one of the most traded currency pair in the forex markets, the price of EURUSD affects many traders. Check out our EURUSD long-term forecast for more information.
placeholder
Copper Long-term forecast: Will Copper Price Expected To Soar In 2023?The price of copper is affected by various of factors. You may wonder how the price of cooper will be in 2023, check out our forecast analysis.
Author  Mitrade
Mar 13, 2023
The price of copper is affected by various of factors. You may wonder how the price of cooper will be in 2023, check out our forecast analysis.
placeholder
Bitcoin CME gaps at $35,000, $27,000 and $21,000, which one gets filled first?Prioritize filling the $27,000 gap and even try higher.
Author  FXStreet
Aug 21, 2023
Prioritize filling the $27,000 gap and even try higher.
placeholder
Natural Gas sinks to pivotal level as China’s demand slumpsNatural Gas price (XNG/USD) edges lower and sinks to $2.56 on Monday, extending its losing streak for the fifth day in a row. The move comes on the back of China cutting its Liquified Natural Gas (LNG) imports after prices rose above $3.0 in June. It
Author  FXStreet
Jul 01, Mon
Natural Gas price (XNG/USD) edges lower and sinks to $2.56 on Monday, extending its losing streak for the fifth day in a row. The move comes on the back of China cutting its Liquified Natural Gas (LNG) imports after prices rose above $3.0 in June. It
placeholder
Weekly Market Outlook: Tesla Kicks Off Big Tech Earnings; U.S. Election Enters Final StretchTradingKey – This week, key economic data includes U.S. September durable goods orders, the University of Michigan’s October Consumer Sentiment Index, and preliminary PMI data from several countries,
Author  Mitrade
22 hours ago
TradingKey – This week, key economic data includes U.S. September durable goods orders, the University of Michigan’s October Consumer Sentiment Index, and preliminary PMI data from several countries,
Related Instrument
goTop
quote