USD/JPY Price Analysis: Surges past 159.00, approaches Yentervention levels

Source Fxstreet
  • USD/JPY rises to 159.59, nearing the pivotal 160.00 mark, propelled by robust US PMI data.
  • Key resistance at 160.00 and YTD high of 160.32; potential for Bank of Japan intervention looms.
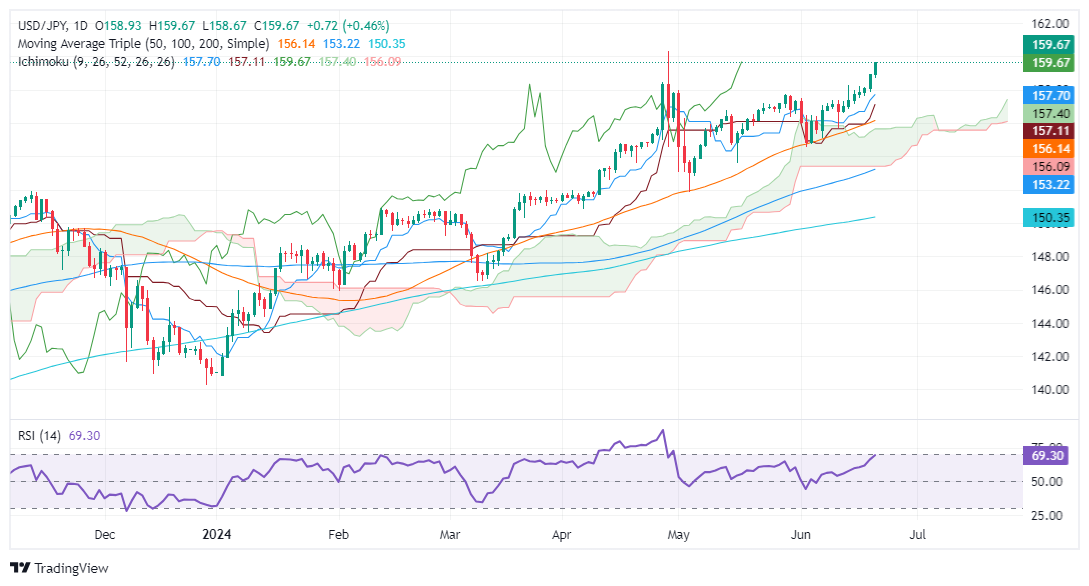
  • Support found at 159.00, June 14 high of 158.25, 158.00, with additional support at Tenkan-Sen (157.69) and Senkou Span A (157.40).

The US Dollar climbs against the Japanese Yen on Friday and approaches intervention levels ahead of the weekend. Stronger than expected US S&P Global Flash PMIs overshadowed weaker housing data and weighed the JPY. Therefore, the USD/JPY trades at 159.59, gains 0.42%.

USD/JPY Price Analysis: Technical outlook

The major has finally broken the barrier of 159.00 and closes to intervention levels reached on April 29, when the USD/JPY cleared the 160.00 figure. This triggered a reaction by the Bank of Japan, which intervened in the FX space, sending the pair tumbling 400 pips to 156.06 after hitting a daily high of 160.32.

Despite that, the USD/JPY remains upward biased, and the next resistance would be 160.00. Once cleared up, next would be the year-to-date (YTD) high of 160.32.

Conversely, the most likely scenario due to intervention threats is the USD/JPY first support of 159.00. Once cleared, the next support would be the June 14 high at 158.25, followed by 158.00. Further losses are seen at the Tenkan-Sen at 157.69, followed by Senkou Span A at 157.40, ahead of the Kijun-Sen at 157.11

USD/JPY Price Action – Daily Chart

USD/JPY

Overview
Today last price 159.66
Today Daily Change 0.72
Today Daily Change % 0.45
Today daily open 158.94
 
Trends
Daily SMA20 157.01
Daily SMA50 156.01
Daily SMA100 153.1
Daily SMA200 150.29
 
Levels
Previous Daily High 158.95
Previous Daily Low 157.84
Previous Weekly High 158.26
Previous Weekly Low 155.72
Previous Monthly High 157.99
Previous Monthly Low 151.86
Daily Fibonacci 38.2% 158.52
Daily Fibonacci 61.8% 158.26
Daily Pivot Point S1 158.2
Daily Pivot Point S2 157.46
Daily Pivot Point S3 157.09
Daily Pivot Point R1 159.31
Daily Pivot Point R2 159.69
Daily Pivot Point R3 160.43


Disclaimer: For information purposes only. Past performance is not indicative of future results.
placeholder
Ethereum (ETH) Price Closes Above $3,900 — Is a New All-Time High Possible Before 2024 Ends?Once again, the price of Ethereum (ETH) has risen above $3,900. This bounce has hinted at a further price increase for the altcoin before the end of the year.
Author  Beincrypto
Dec 17, 2024
Once again, the price of Ethereum (ETH) has risen above $3,900. This bounce has hinted at a further price increase for the altcoin before the end of the year.
placeholder
My Top 5 Stock Market Predictions for 2026Five 2026 market predictions written in a native, news-style voice: AI’s winners and losers, broader sector leadership, dividend demand, valuation cooling as the Shiller CAPE sits at 39 (Dec. 31, 2025), and quantum-computing bursts—while keeping all original facts and numbers unchanged.
Author  Mitrade
Jan 06, Tue
Five 2026 market predictions written in a native, news-style voice: AI’s winners and losers, broader sector leadership, dividend demand, valuation cooling as the Shiller CAPE sits at 39 (Dec. 31, 2025), and quantum-computing bursts—while keeping all original facts and numbers unchanged.
placeholder
Analyst Flags XRP as Market’s ‘Best Risk/Reward’ Play as Token Tests Critical $1.60 SupportCrypto analyst Scott Melker identifies a prime risk/reward setup for XRP as it tests key support at $1.60, offering a tight stop-loss against potential upside targets near $2.00.
Author  Mitrade
Feb 03, Tue
Crypto analyst Scott Melker identifies a prime risk/reward setup for XRP as it tests key support at $1.60, offering a tight stop-loss against potential upside targets near $2.00.
placeholder
Ethereum Price Forecast: ETH faces heavy distribution as price slips below average cost basis of investorsEthereum (ETH) extended its decline on Wednesday, dropping more than 5% over the past 24 hours toward the $2,100 level, which is below the $2,310 average cost basis or realized price of investors, according to CryptoQuant's data.
Author  FXStreet
Feb 05, Thu
Ethereum (ETH) extended its decline on Wednesday, dropping more than 5% over the past 24 hours toward the $2,100 level, which is below the $2,310 average cost basis or realized price of investors, according to CryptoQuant's data.
placeholder
Bitcoin Surrenders $65,000 as Analysts Warn of ‘Structural’ Market BreakBitcoin plunges 11% to break $65k as analysts term the crash "structural," citing a $1 trillion market wipeout and $2.09 billion in daily liquidations.
Author  Mitrade
Feb 06, Fri
Bitcoin plunges 11% to break $65k as analysts term the crash "structural," citing a $1 trillion market wipeout and $2.09 billion in daily liquidations.
Related Instrument
goTop
quote