NZD/JPY Price Analysis: Bulls try to maintain the uptrend despite persisting consolidation

Source Fxstreet
  • The consolidation phase extends as the Kiwi witnesses difficulty against the Yen.
  • Indicators on the daily chart trend downwards, indicating potential for further consolidation in the upcoming sessions.
  • Retesting the 97.00 level could be on the cards, but a break above this resistance appears unlikely due to weak buying traction.

On Monday, the NZD/JPY pair extended its consolidation phase after hitting a multi-year high last week. The technical landscape suggests that sellers may have their chance as consolidation continues, potentially limiting the pair's upward movement under the key resistance level of 97.00. However, the 20-day Simple Moving Average (SMA) is holding as strong support and bulls continue to defend it.

The daily Relative Strength Index (RSI) for NZD/JPY now stands at 60, indicating a slight retracement downwards and a decrease in the bullish momentum. The Moving Average Convergence Divergence (MACD) continues to print rising red bars, indicating an ongoing consolidation phase.

NZD/JPY daily chart

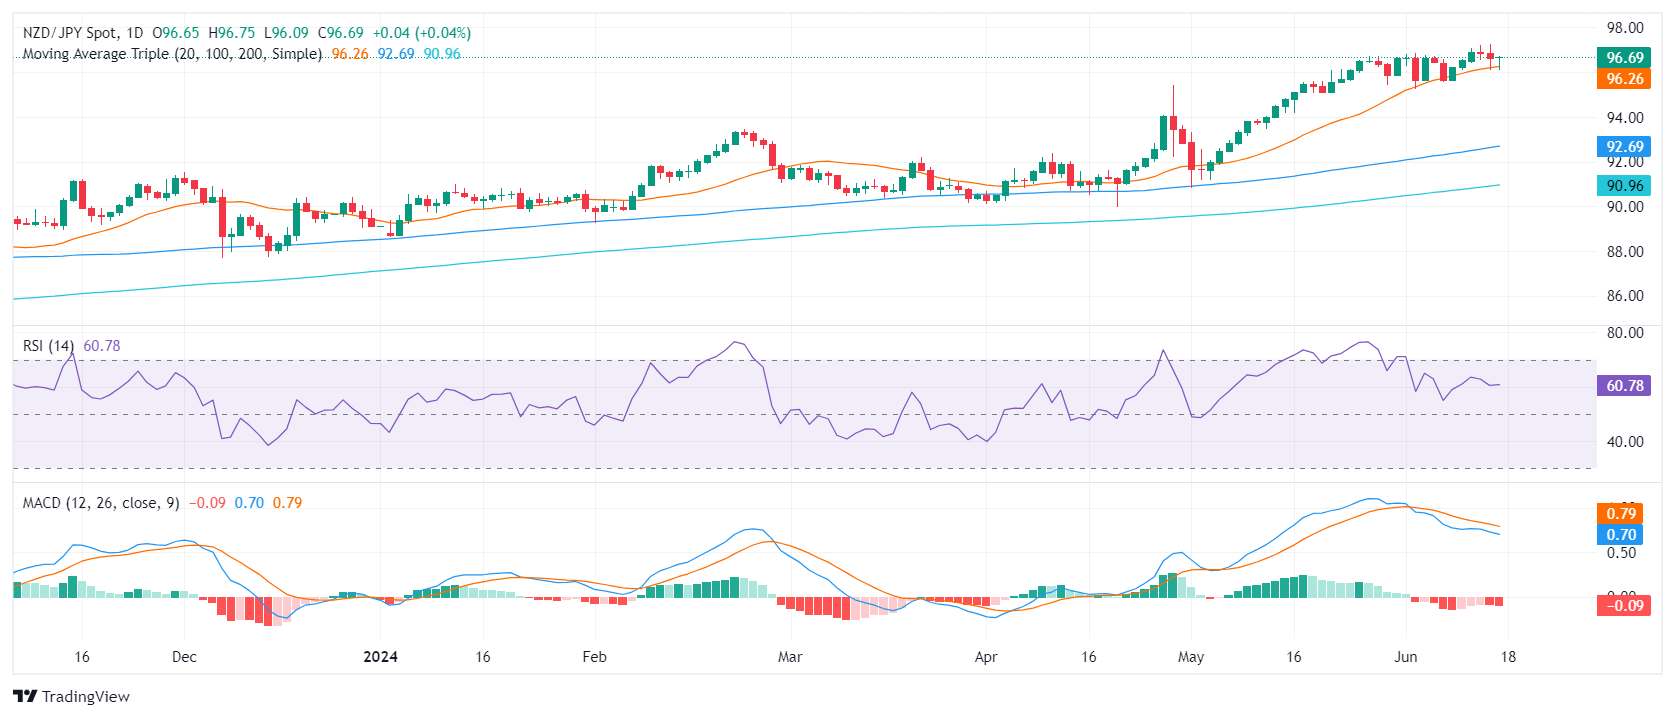
Buyers continue to maintain their stand above the 20-day Simple Moving Average (SMA), demonstrating an effort to uphold the bullish trend. Regardless, the downturn observed in the daily technical indicators points towards the market's need for further consolidation after the significant leap to nearly 96.00 since May.

The upcoming trading sessions might witness the pair movings between the support level of 95.00 and the resistance level of 97.00 as this pair remains among the tallest since June 2007. Notably, the bears have struggled twice consecutively to breach the 20-day SMA at 96.20, making it unlikely for the downtrend to continue The longer-term 100-day and 200-day Simple Moving Averages (SMAs), established roughly around 90.00 - 92.00, continue to protect the overall bullish aspect of the pair. The area around 95.30 also offers substantial support against potential losses.


NZD/JPY

Overview
Today last price 96.69
Today Daily Change 0.04
Today Daily Change % 0.04
Today daily open 96.65
 
Trends
Daily SMA20 96.2
Daily SMA50 94.03
Daily SMA100 92.63
Daily SMA200 90.91
 
Levels
Previous Daily High 97.25
Previous Daily Low 96.1
Previous Weekly High 97.25
Previous Weekly Low 95.62
Previous Monthly High 96.74
Previous Monthly Low 90.83
Daily Fibonacci 38.2% 96.54
Daily Fibonacci 61.8% 96.81
Daily Pivot Point S1 96.08
Daily Pivot Point S2 95.52
Daily Pivot Point S3 94.93
Daily Pivot Point R1 97.24
Daily Pivot Point R2 97.82
Daily Pivot Point R3 98.39


Disclaimer: For information purposes only. Past performance is not indicative of future results.
placeholder
‘War Against Bitcoin Miners’: US Investment Firm Sparks Industry BacklashKerrisdale Capital, a US investment firm, set off a storm of reactions on Wednesday with a series of public communications aggressively targeting Bitcoin mining companies. In a multi-part thread on X, Kerrisdale announced its campaign against what it describes as “snake oil salesmen” in the BTC mining industry, accusing them of being both a financial […]
Author  Bitcoinist
Jun 06, 2024
Kerrisdale Capital, a US investment firm, set off a storm of reactions on Wednesday with a series of public communications aggressively targeting Bitcoin mining companies. In a multi-part thread on X, Kerrisdale announced its campaign against what it describes as “snake oil salesmen” in the BTC mining industry, accusing them of being both a financial […]
placeholder
An Overview of US Labour Reports: A Guide to Nonfarm Payrolls(NFP) & Market ImpactTradingKey - When it comes to US economic data, the Nonfarm Payrolls (NFP) is indeed one of the most significant indicators. This employment report, covering more than 90% of the employed population i
Author  TradingKey
Mar 07, 2025
TradingKey - When it comes to US economic data, the Nonfarm Payrolls (NFP) is indeed one of the most significant indicators. This employment report, covering more than 90% of the employed population i
placeholder
Gold price fills opening gap amid subdued USD demand; bulls still seem reluctantGold price attracts some buyers near the $3,312-3,311 region during the Asian session on Monday and fills a modest bearish gap opening amid subdued USD price action.
Author  FXStreet
Jul 28, 2025
Gold price attracts some buyers near the $3,312-3,311 region during the Asian session on Monday and fills a modest bearish gap opening amid subdued USD price action.
placeholder
Solana Price Forecast: SOL extends recovery as trading volume surgesSolana (SOL) price extends its recovery, trading above $192 at the time of writing on Monday, after rebounding from the ascending trendline support last week.
Author  FXStreet
Oct 20, 2025
Solana (SOL) price extends its recovery, trading above $192 at the time of writing on Monday, after rebounding from the ascending trendline support last week.
placeholder
Silver Price Forecast: XAG/USD bulls look to build on momentum beyond $79.00Silver (XAG/USD) builds on the previous day's positive move and gains strong follow-through traction for the second straight day on Tuesday.
Author  FXStreet
Jan 06, Tue
Silver (XAG/USD) builds on the previous day's positive move and gains strong follow-through traction for the second straight day on Tuesday.
Related Instrument
goTop
quote