USD/CHF Price Analysis: Rises to 0.8950 as Fed dials back multiple rate-cut prospects

Source Fxstreet
  • USD/CHF recovers further to 0.8955 as the Fed maintains a hawkish narrative on the interest rate outlook.
  • Investors await the US PPI to get more cues for more guidance.
  • Weak Swiss produce inflation boosts SNB’s subsequent rate-cut bets.

The USD/CHF pair edges higher to 0.8955 in Thursday’s European session. The Swiss Franc asset holds the strong recovery move of Wednesday as the US Dollar (USD) rises amid expectations that the Federal Reserve (Fed) will not reduce interest rates more than once this year.

The US Dollar Index (DXY) extends recovery to 104.80 after the Fed signaled only one rate cut this year against three anticipated when policymakers last met in March. The Fed maintained a “higher for longer” interest rate narrative despite acknowledging that soft May report is encouraging. However, Fed Chair Jerome Powell cleared that policymakers need more good inflation data for months to build confidence before considering rate cuts.

Going forward, investors will focus on the US Producer Price Index (PPI) report for May, which will be published at 12:30 GMT. The PPI report will indicate the change in prices of goods and services done at the factory gates.

Meanwhile, the Swiss Franc weakens after weak Producer and Import Prices for May. On a month-on-month basis, producer inflation unexpectedly contracted by 0.3%, while investors forecasted it to rise by 0.5%. Annual PPI contracted at a steady pace of 1.8%, which would boost expectations of subsequent rate cuts by the Swiss National Bank (SNB) in June’s policy meeting.

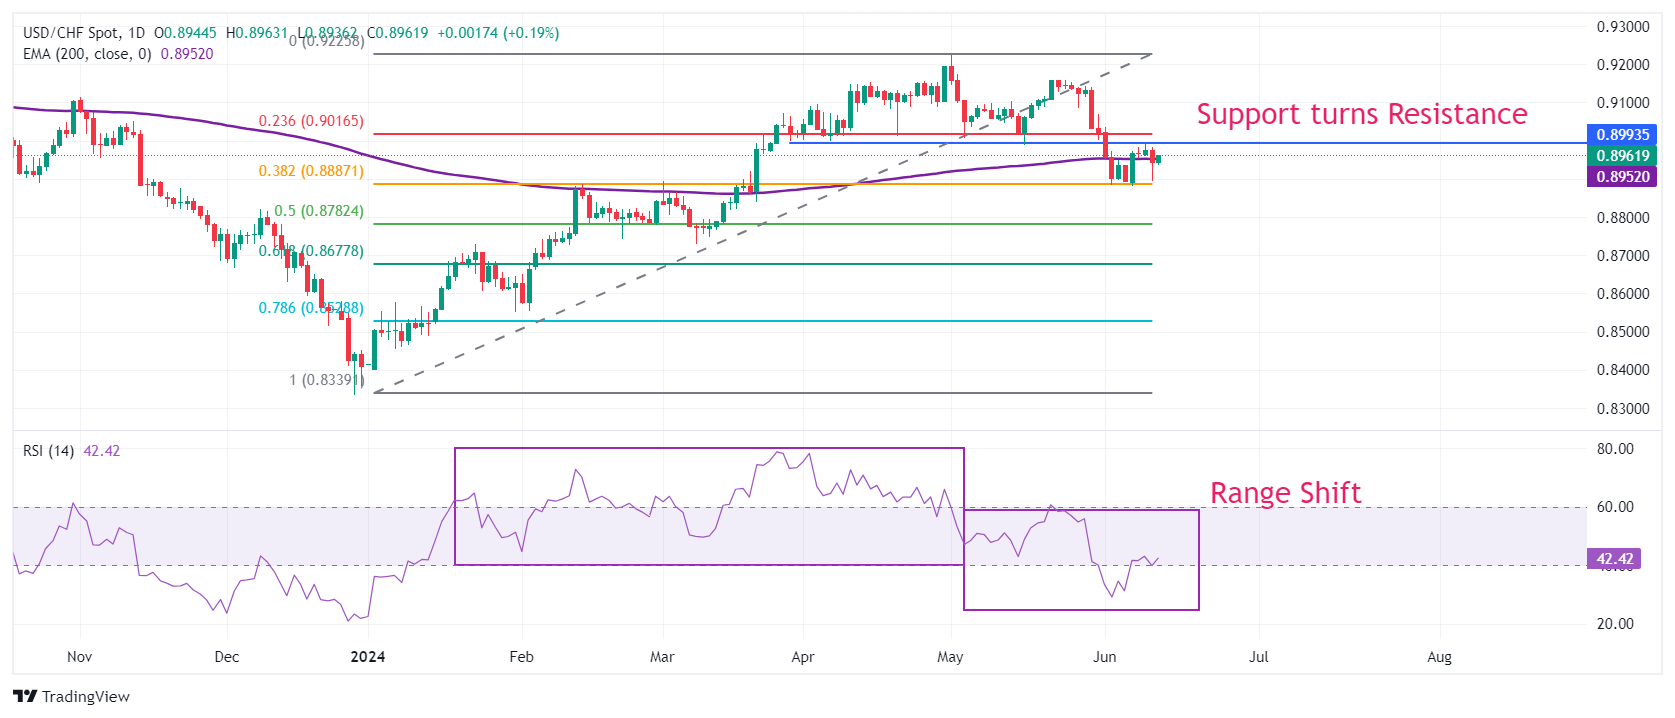
USD/CHF continues to take support near the 38.2% Fibonacci retracement support at 0.8885, plotted from 28 December 2023 low at 0.8333 to May 1 high at 0.9225. Earlier, the Swiss Franc asset weakened after breaking below the horizontal support marked from March 28 low near 0.9000, which has become a major resistance for the US Dollar bulls.

The major's long-term trend is uncertain as it hovers near the 200-day Exponential Moving Averages (EMAs), which trade around 0.8950.

The 14-period Relative Strength Index (RSI) shifts into the bearish range of 20.00-60.00 from the bullish range of 40.00-80.00, indicating a bearish reversal.

Going forward, more recovery above the psychological resistance of 0.9000 will drive the asset towards June 3 high at 0.9036, followed by May 28 low at 0.9086.

On the flip side, the asset would expose to March 21 low at 0.8840 and the round-level support of 0.8800 will open if the asset breaks below June 4 low of 0.8900.

USD/CHF daily chart

USD/CHF

Overview
Today last price 0.8961
Today Daily Change 0.0017
Today Daily Change % 0.19
Today daily open 0.8944
 
Trends
Daily SMA20 0.904
Daily SMA50 0.9074
Daily SMA100 0.8948
Daily SMA200 0.8894
 
Levels
Previous Daily High 0.8984
Previous Daily Low 0.8893
Previous Weekly High 0.9036
Previous Weekly Low 0.8881
Previous Monthly High 0.9225
Previous Monthly Low 0.8988
Daily Fibonacci 38.2% 0.8928
Daily Fibonacci 61.8% 0.8949
Daily Pivot Point S1 0.8897
Daily Pivot Point S2 0.885
Daily Pivot Point S3 0.8807
Daily Pivot Point R1 0.8988
Daily Pivot Point R2 0.9031
Daily Pivot Point R3 0.9078


Disclaimer: For information purposes only. Past performance is not indicative of future results.
placeholder
New Fed Chair to Cut Forward Guidance? Warsh Rejects Dot-Plot Expectations, Bullish or Bearish for Bitcoin? If Warsh rejects dot plot projections, it could suppress institutional capital and weaken market risk appetite in the short term, but is a long-term positive for Bitcoin.On June 17, Asian
Author  TradingKey
7 hours ago
If Warsh rejects dot plot projections, it could suppress institutional capital and weaken market risk appetite in the short term, but is a long-term positive for Bitcoin.On June 17, Asian
placeholder
Three Major International Investment Banks Bearish on Oil Outlook, Citi Expects Brent to Fall to $70. Crude Oil Prices Fall for Four Straight Days to Levels at Start of US-Iraq War.On June 16, after US President Donald Trump sent consecutive signals of geopolitical easing, the two major crude oil benchmarks extended their recent declines and are poised to return to
Author  TradingKey
15 hours ago
On June 16, after US President Donald Trump sent consecutive signals of geopolitical easing, the two major crude oil benchmarks extended their recent declines and are poised to return to
placeholder
Japanese Yen hangs near intervention zone despite BoJ rate hike, ahead of FOMCThe USD/JPY pair ticks lower during the Asian session on Wednesday, though it remains within striking distance of the highest level since late April, touched last week.
Author  FXStreet
16 hours ago
The USD/JPY pair ticks lower during the Asian session on Wednesday, though it remains within striking distance of the highest level since late April, touched last week.
placeholder
Has Gold Hit Bottom? Barclays, Citi Both Bullish on Gold, Gold Price Will Return to $5,000 Next Year.Since 2026, gold has erased almost all of its gains and has fallen more than 20% from its record high of $5,595 set at the end of January. Has gold bottomed out? Is now the time to add to
Author  TradingKey
Yesterday 10: 30
Since 2026, gold has erased almost all of its gains and has fallen more than 20% from its record high of $5,595 set at the end of January. Has gold bottomed out? Is now the time to add to
placeholder
WTI hovers around $80.00 as traders await developments on US-Iran peace talksWest Texas Intermediate (WTI) oil price inches higher after registering 3.7% losses in the previous day, trading around $80.10 per barrel during the Asian hours on Tuesday.
Author  FXStreet
Yesterday 01: 19
West Texas Intermediate (WTI) oil price inches higher after registering 3.7% losses in the previous day, trading around $80.10 per barrel during the Asian hours on Tuesday.
goTop
quote