

GBP/JPY shrugs off UK data misses to test fresh 16-year high
- Guppy tips into new 16-year high of 200.95 despite soft UK data.
- UK Manufacturing Production tumbled in April, contracted more than expected.
- Yen traders look ahead to Friday’s latest rate call from BoJ.
GBP/JPY found a new 16-year high of 200.95 on Wednesday, with Guppy bidders shrugging off a steep miss in UK manufacturing activity as the Yen continues to weaken across the board.
UK Manufacturing Production saw its sharpest drawdown since 2021, declining -1.4% MoM in April and completely missing the forecast -0.2% contraction from the previous month’s scant 0.3% growth. GBP traders shrugged off the downside print in UK manufacturing activity to bid the Sterling higher against the Yen, clipping into a 16-year peak before slipping back slightly amidst broad-market flows.
Yen markets are pivoting to face the Bank of Japan’s (BoJ) latest rate call and Monetary Policy Statement. The BoJ has left the Yen notoriously unprotected as the Japanese central bank’s hypereasy policy stance leaves the JPY notably weak, with Yen flows floundering as the rate differential between the BoJ and other major global central banks weighs on JPY strength.
GBP/JPY technical outlook
GBP/JPY continues to pin firmly into bullish territory, trading north of the 200-hour Exponential Moving Average (EMA) at 199.73. The pair’s tilt into new highs on Wednesday leaves the pair overextended with few technical resistance points in the way. However, overbought conditions could see a near-term snap back to consolidation levels near 199.50.
GBP/JPY hourly chart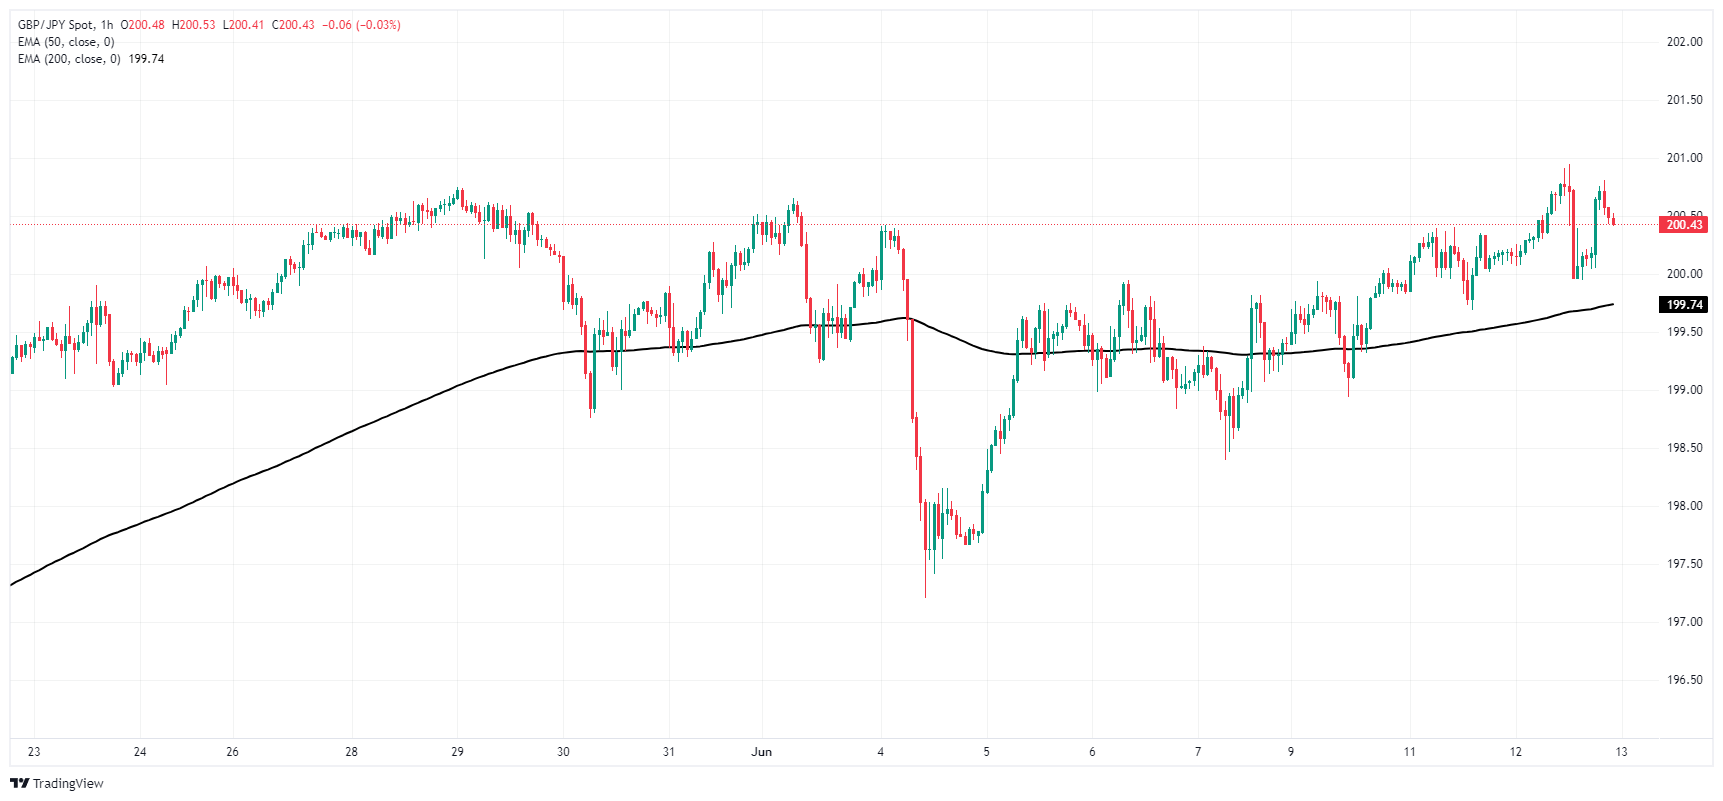
GBP/JPY daily chart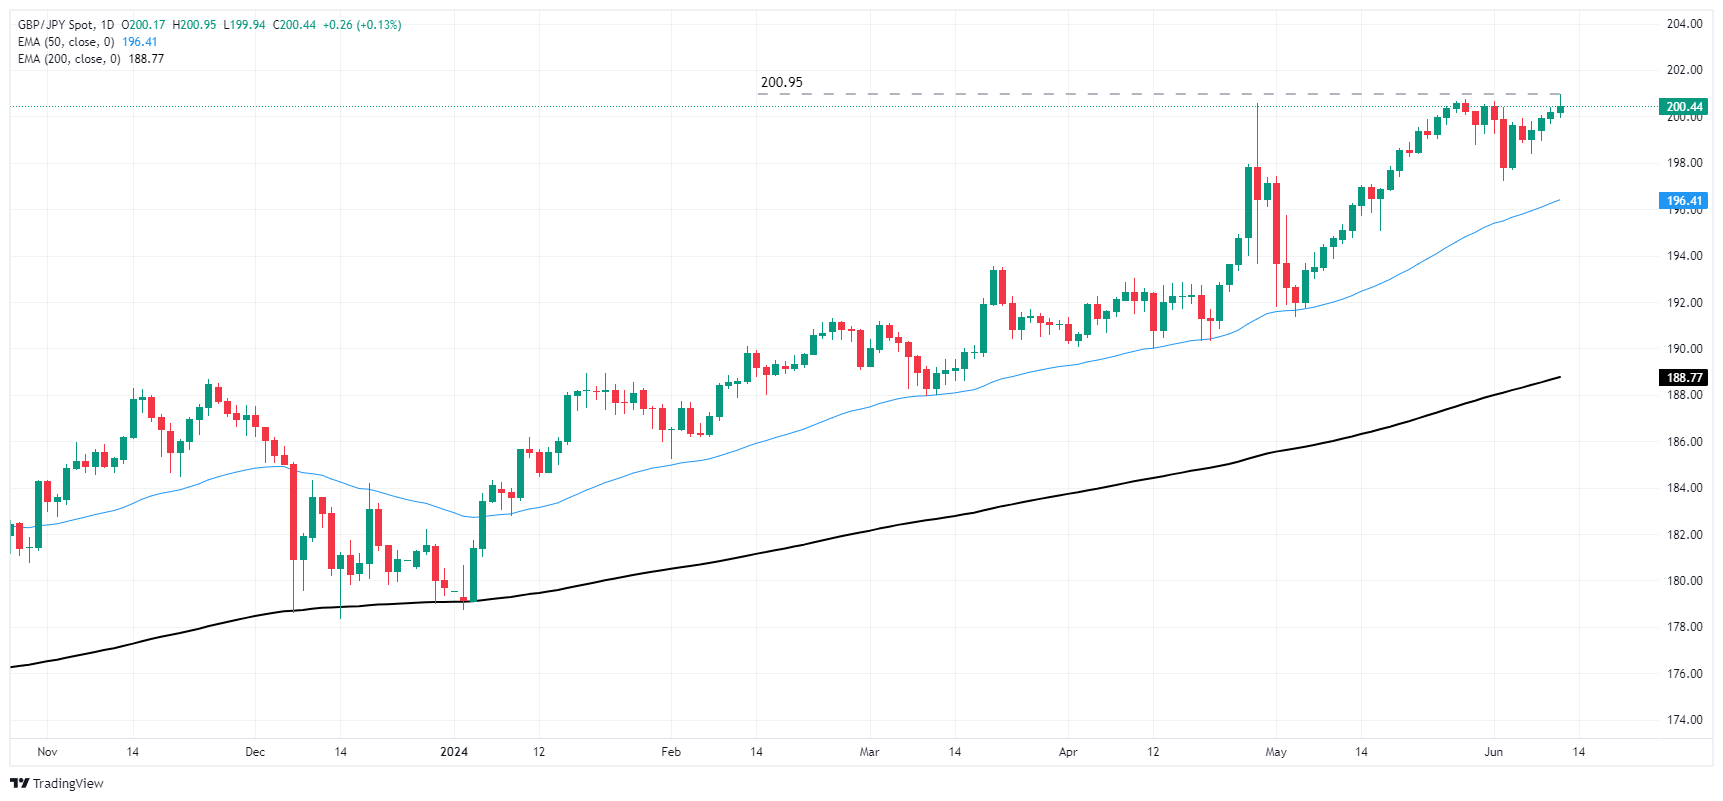
Recommended Articles


