AUD/JPY Price Analysis: Bulls push past the 20-day SMA, with consolidation still prevalent

Source Fxstreet
  • The AUD/JPY pair surpassed the 20-day SMA, indicating a rising bullish momentum.
  • Despite the rise, the pair is still in a consolidation phase, hinting at the possibility of limited gains.
  • The bull's next target stands at 105.00.

In Wednesday's session, the AUD/JPY pair exhibited a promising move, surpassing the 20-day Simple Moving Average (SMA) at 103.90. This could be a positive sign, demonstrating strength in the Australian Dollar against its competitors. However, the ongoing consolidation phase suggests that there may not be enough momentum for a persistent rise.

The daily Relative Strength Index (RSI) for the AUD/JPY currently stands at 59 suggesting a significant shift from Tuesday’'s 53. On the other hand, the Moving Average Convergence Divergence (MACD) continues to display decreasing red bars, suggesting a potential weakening in the bearish momentum.

AUD/JPY daily chart

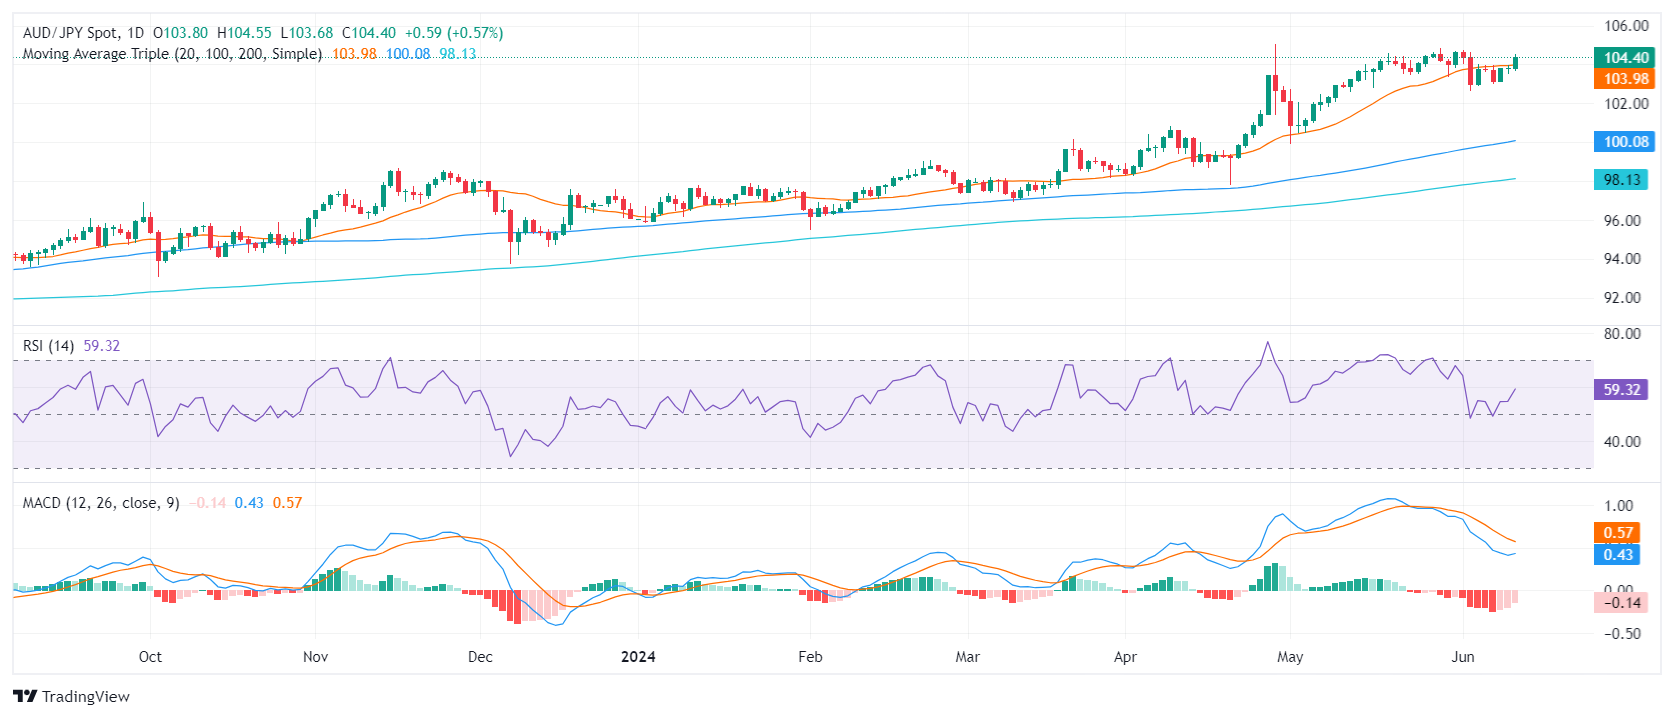
In conclusion, the AUD/JPY pair seems to be in a consolidation phase, despite successfully rising above the 20-day SMA. The range of 102.00-103.00 may denote the next trading patterns unless the bulls retain control above the 20-day SMA. Nonetheless, the reduction in selling momentum could denote a preparation by the bulls for the next upward swing and might retest the 105.00 area.

AUD/JPY

Overview
Today last price 104.38
Today Daily Change 0.57
Today Daily Change % 0.55
Today daily open 103.81
 
Trends
Daily SMA20 103.94
Daily SMA50 102.14
Daily SMA100 100.01
Daily SMA200 98.07
 
Levels
Previous Daily High 103.95
Previous Daily Low 103.53
Previous Weekly High 104.73
Previous Weekly Low 102.62
Previous Monthly High 104.87
Previous Monthly Low 99.93
Daily Fibonacci 38.2% 103.79
Daily Fibonacci 61.8% 103.69
Daily Pivot Point S1 103.58
Daily Pivot Point S2 103.34
Daily Pivot Point S3 103.16
Daily Pivot Point R1 103.99
Daily Pivot Point R2 104.18
Daily Pivot Point R3 104.41


Disclaimer: For information purposes only. Past performance is not indicative of future results.
placeholder
Crypto’s Great Recovery: Is the Post-Conflict Surge a Sustainable Rally or a Sophisticated Bull Trap?President Trump claimed the war is essentially over, as cryptocurrencies surged across the board and Bitcoin broke through $70,000.
Author  TradingKey
10 hours ago
President Trump claimed the war is essentially over, as cryptocurrencies surged across the board and Bitcoin broke through $70,000.
placeholder
WTI recovers to near $86.50 as Strait of Hormuz remains closedWest Texas Intermediate (WTI), the US crude oil benchmark, is trading around $86.40 during the early Asian trading hours on Tuesday. The WTI price faces extreme volatility following a massive spike to nearly $120 per barrel in the previous session. 
Author  FXStreet
19 hours ago
West Texas Intermediate (WTI), the US crude oil benchmark, is trading around $86.40 during the early Asian trading hours on Tuesday. The WTI price faces extreme volatility following a massive spike to nearly $120 per barrel in the previous session. 
placeholder
International Oil Prices Retreat Rapidly; G-7 to Discuss Emergency Oil Reserve Release On the afternoon of March 9, Beijing time, following a surge in international crude oil prices triggered by escalating geopolitical conflicts in the Middle East, the Group of Seven (G7) u
Author  TradingKey
Yesterday 10: 17
On the afternoon of March 9, Beijing time, following a surge in international crude oil prices triggered by escalating geopolitical conflicts in the Middle East, the Group of Seven (G7) u
placeholder
Gold slumps to near $5,050 on oil-driven inflation fears, stronger US DollarGold price (XAU/USD) falls to around $5,065 during the early Asian session on Monday, pressured by a stronger US Dollar (USD) and inflationary risks. Traders will closely monitor the developments surrounding the US-Iran conflicts and geopolitical risks in the Middle East.
Author  FXStreet
Yesterday 01: 41
Gold price (XAU/USD) falls to around $5,065 during the early Asian session on Monday, pressured by a stronger US Dollar (USD) and inflationary risks. Traders will closely monitor the developments surrounding the US-Iran conflicts and geopolitical risks in the Middle East.
placeholder
On the Eve of Nonfarm Payrolls, How Will Employment Data Affect Stock Market Trends and Rate Cut Expectations?TradingKey - The U.S. Bureau of Labor Statistics will release the February non-farm payroll (NFP) data at 8:30 AM ET on March 6. This release comes as the market is oscillating between Middle East geo
Author  TradingKey
Mar 06, Fri
TradingKey - The U.S. Bureau of Labor Statistics will release the February non-farm payroll (NFP) data at 8:30 AM ET on March 6. This release comes as the market is oscillating between Middle East geo
Related Instrument
goTop
quote