

USD/JPY retreats amid Fed’s hawkish hold, traders eye Powell’s speech

Source Fxstreet
  • Fed maintains interest rates; projects higher rates through 2024 with a federal funds rate adjustment to 5.10%.
  • Cooler US inflation report pressures the Greenback, leading to a decline in USD/JPY.
  • Fed's economic outlook: Stable growth at 2.1%, steady unemployment at 4%, with minor hikes in PCE and Core PCE inflation rates.

The USD/JPY retreated on Wednesday after the Federal Reserve's decision to keep interest rates unchanged while tilting slightly hawkish as Fed officials upward revised the federal fund's rates. However, a cooler-than-expected US inflation report weighed on the Greenback ahead of Fed Chair Jerome Powell's presser. The major trades at 156.26, down 0.55%.

USD/JPY drops 0.55% amid Fed's hawkish hold, cooler US inflation report

The Federal Reserve’s monetary policy statement highlighted that Fed officials do "not expect it will be appropriate to reduce the target range until it has gained greater confidence that inflation is moving sustainably toward 2 percent." They also stated that "the Committee would be prepared to adjust the stance of monetary policy as appropriate if risks emerge that could impede the attainment of the Committee’s goals."

Meanwhile, the Summary of Economic Projections (SEP) revealed that policymakers tilted slightly hawkish, as the median foresees the federal funds rate to end at 5.10% in 2024, up from 4.60% in March’s projections. The economy is expected to grow 2.1%, consistent with their March forecast, while the unemployment rate is projected to remain at 4%, unchanged from the previous SEP. PCE inflation is expected to rise slightly from 2.4% to 2.6%, and Core PCE inflation is projected to increase from 2.6% to 2.8%.

USD/JPY Reaction to Fed’s Decision - Hourly Chart
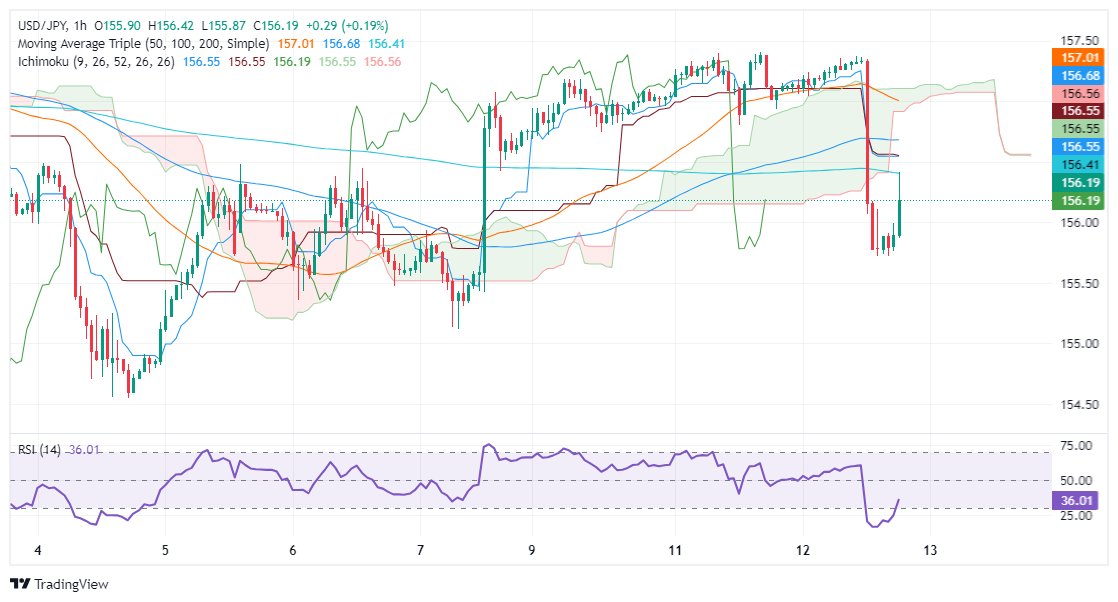
The USD/JPY bounced off daily lows at around 155.80 and edged above the 156.00 figure, but it was capped by the 100-Simple Moving Average (SMA) at 156.55. For buyers to extend its gains, they must clear the 100-SMA, and test the bottom of the Ichimoku Cloud at around 156.80/95. Further gains are seen above 157.00.

USD/JPY

Overview
Today last price 156.39
Today Daily Change -0.73
Today Daily Change % -0.46
Today daily open 157.12
 
Trends
Daily SMA20 156.42
Daily SMA50 155.23
Daily SMA100 152.39
Daily SMA200 149.93
 
Levels
Previous Daily High 157.4
Previous Daily Low 156.81
Previous Weekly High 157.47
Previous Weekly Low 154.55
Previous Monthly High 157.99
Previous Monthly Low 151.86
Daily Fibonacci 38.2% 157.18
Daily Fibonacci 61.8% 157.03
Daily Pivot Point S1 156.82
Daily Pivot Point S2 156.51
Daily Pivot Point S3 156.22
Daily Pivot Point R1 157.42
Daily Pivot Point R2 157.71
Daily Pivot Point R3 158.01


Disclaimer: For information purposes only. Past performance is not indicative of future results.
placeholder
Nvidia reports tomorrow with an interim CEO — $108 billion is the easy numberNvidia closed at 162.85 on Friday, down 12.75% on the week and 32% below its 6 October record, with market value down to $3.92 trillion. The Q3 bar is $108 billion ±2%, and consensus already sits at $108.7 ~ 108.8 billion, so the revenue line is not where the surprise lives. The number that decides the reaction is the 71 ~ 72% Q4 gross-margin trough, followed by a Q4 guide against a $124.9 billion consensus. This piece prices the print, marks the 158.39 line and lays out the three scenarios in a table.
Author  Irene Q.
Yesterday 02: 11
Nvidia closed at 162.85 on Friday, down 12.75% on the week and 32% below its 6 October record, with market value down to $3.92 trillion. The Q3 bar is $108 billion ±2%, and consensus already sits at $108.7 ~ 108.8 billion, so the revenue line is not where the surprise lives. The number that decides the reaction is the 71 ~ 72% Q4 gross-margin trough, followed by a Q4 guide against a $124.9 billion consensus. This piece prices the print, marks the 158.39 line and lays out the three scenarios in a table.
placeholder
Anthropic is six times oversubscribed at $1.4 trillion while Nvidia is down 32% — the AI trade has two pricesAnthropic lists on Nasdaq as ANT on Thursday at $70 ~ $78 a share, raising up to $64.4 billion at a target valuation near $1.4 trillion, and the book is reportedly six times covered. In the same six weeks, Nvidia has fallen 32% and the QQQ is 10.9% below its October peak. Private capital and public markets are marking the same AI complex at two very different prices. This piece separates the two books: what the S-1 shows, who is anchoring the $26 billion private placement, and what Thursday's debut would have to do to change the public tape.
Author  Irene Q.
Yesterday 02: 27
Anthropic lists on Nasdaq as ANT on Thursday at $70 ~ $78 a share, raising up to $64.4 billion at a target valuation near $1.4 trillion, and the book is reportedly six times covered. In the same six weeks, Nvidia has fallen 32% and the QQQ is 10.9% below its October peak. Private capital and public markets are marking the same AI complex at two very different prices. This piece separates the two books: what the S-1 shows, who is anchoring the $26 billion private placement, and what Thursday's debut would have to do to change the public tape.
placeholder
Weekly Report: The index rose 2.5% while Nvidia fell 12.7% — two equity divergences, one should closeThe S&P 500 rose 2.51% to 7,561.67 and the QQQ rose 3.63% to 679.89 last week, while Nvidia fell 12.75% to 162.85 — a sixth straight weekly loss and 32% below its October record. In the same five sessions, energy equities rose 5.42% while WTI fell 2.52%. Both pairs normally move together (60-day correlations of +0.64 and +0.58). This report ranks which divergence closes first, with the trigger for each.
Author  Irene Q.
Yesterday 02: 35
The S&P 500 rose 2.51% to 7,561.67 and the QQQ rose 3.63% to 679.89 last week, while Nvidia fell 12.75% to 162.85 — a sixth straight weekly loss and 32% below its October record. In the same five sessions, energy equities rose 5.42% while WTI fell 2.52%. Both pairs normally move together (60-day correlations of +0.64 and +0.58). This report ranks which divergence closes first, with the trigger for each.
placeholder
Gold Price Analysis Today | Forex Gold Analysis | XAU/USD Analysis - November 16, 2026Get the latest gold price analysis, forex gold insights, and XAU/USD analysis for November 16, 2026. Read on for the details.
Author  Mitrade
Yesterday 02: 45
Get the latest gold price analysis, forex gold insights, and XAU/USD analysis for November 16, 2026. Read on for the details.
placeholder
Weekly Report: DXY 103.41, 10-year 5.15%, AUD carry 3bp — three FX regimes flipped in one weekThe dollar index rose 1.09% to 103.41, a 19-month high, while the US 10-year closed at 5.154% and the Australia-US two-year spread collapsed to about 3 basis points from 36. EURUSD fell 1.59% to 1.1024, USDJPY rose 1.51% to 159.78 and AUDUSD fell 1.79% to 0.6764, a 10-month low. Three FX regimes — the broad dollar, the US rate level and the Australian carry premium — flipped in the same week. This report marks the thresholds, ranks which one can flip back first, and lists the week's calendar.
Author  Irene Q.
Yesterday 03: 26
The dollar index rose 1.09% to 103.41, a 19-month high, while the US 10-year closed at 5.154% and the Australia-US two-year spread collapsed to about 3 basis points from 36. EURUSD fell 1.59% to 1.1024, USDJPY rose 1.51% to 159.78 and AUDUSD fell 1.79% to 0.6764, a 10-month low. Three FX regimes — the broad dollar, the US rate level and the Australian carry premium — flipped in the same week. This report marks the thresholds, ranks which one can flip back first, and lists the week's calendar.
Related Instrument
goTop
quote