GBP/USD clears some gains after Fed's decision and Dot Plot revision

Source Fxstreet
  • The Fed held rates steady at 5.25%-5.50% as expected.
  • The dot plot indicated that most of the FOMC members are seeing fewer rate cuts this year.
  • As an initial reaction, the USD recovered and the pair cleared some of its daily losses.

On Wednesday, the GBP/USD cleared some of its gains following the Federal Reserve (Fed) decision to hold rates steady at 5.25%-5.50% and stands at 1.2830. What strengthened the USD is that the Dot Plot suggested that the members are seeing two instead of three rate cuts in 2024.

Regarding economic protections, the bank revised its Personal Consumption Expenditures (PCE) forecasts to 2.4% YoY from 2.6% YoY, while growth protections remain unchanged. The interest protections, via the so-called Dot Plot,  showed an upward revision of the interest rates by the end of 2024 now at 5.1%, up from 4.6%, and for the 2025 at 4.1%, up from 3.9%. The proyection for 2026 stood at 3.1%, and the longer-run rate has been revised to 2.8% from 2.6%. 

As a reaction, the USD recovered some ground following the soft Consumer Price Index (CPI) figures from May which triggered a sharp decline in US Treasury bond yields earlier in the session. The US 2,5 and 10 rates cleared some losses but are still down by more than 2%.

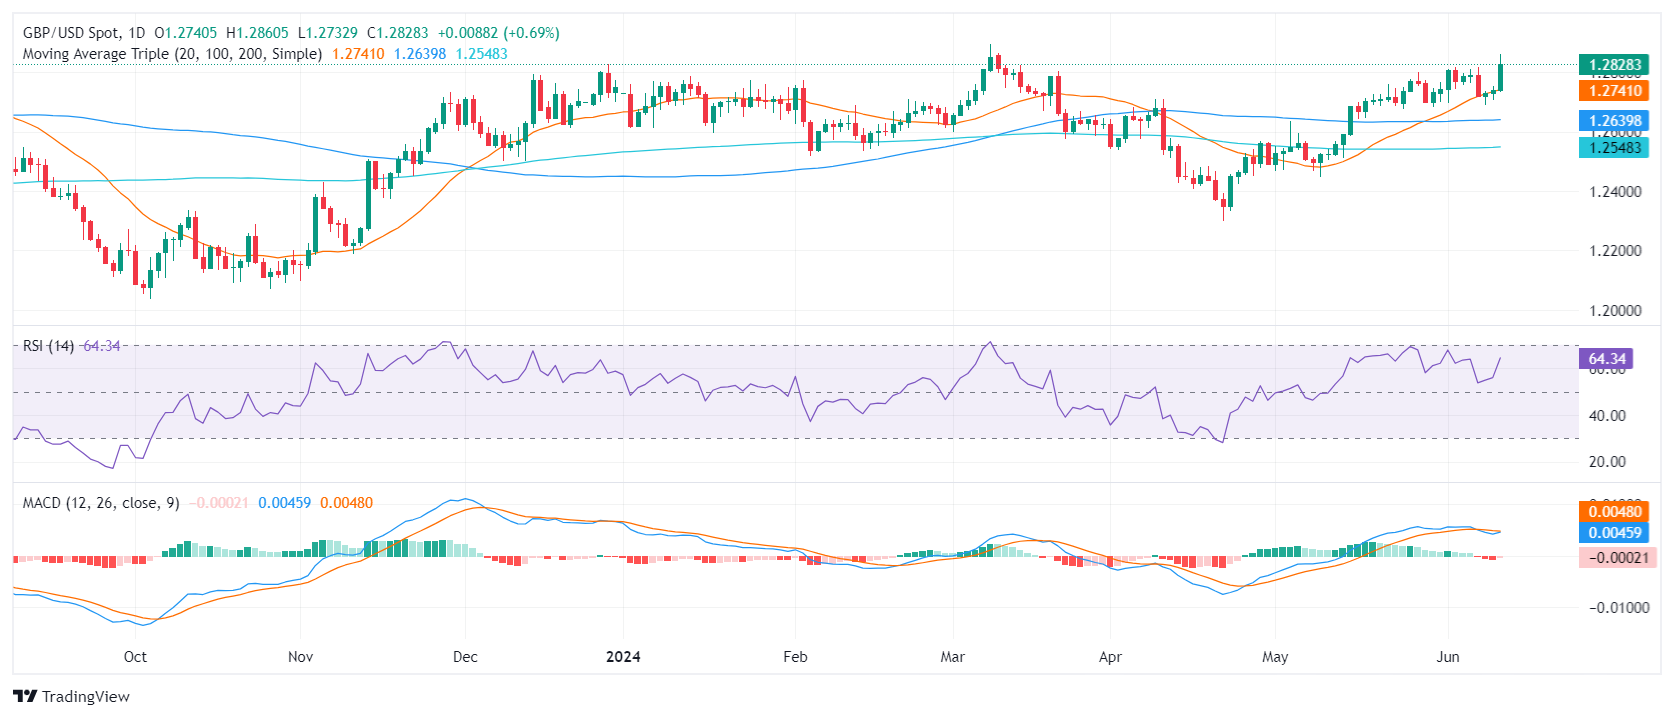
GBP/USD Technical analysis

Indicators on the daily chart significantly recovered and remain deep in positive terrain. The Relative Strength Index (RSI) moved towards 60 while the Moving Average Convergence Divergence (MACD) prints decreasing red bars, indicating a decreasing selling pressure. The overall outlook remains positive as the pair rides above the 20,100 and 200-day Simple Moving Averages (SMA).

GBP/USD

Overview
Today last price 1.2839
Today Daily Change 0.0099
Today Daily Change % 0.78
Today daily open 1.274
 
Trends
Daily SMA20 1.2734
Daily SMA50 1.2606
Daily SMA100 1.2639
Daily SMA200 1.2547
 
Levels
Previous Daily High 1.2752
Previous Daily Low 1.2706
Previous Weekly High 1.2818
Previous Weekly Low 1.2695
Previous Monthly High 1.2801
Previous Monthly Low 1.2446
Daily Fibonacci 38.2% 1.2734
Daily Fibonacci 61.8% 1.2723
Daily Pivot Point S1 1.2713
Daily Pivot Point S2 1.2687
Daily Pivot Point S3 1.2668
Daily Pivot Point R1 1.2759
Daily Pivot Point R2 1.2778
Daily Pivot Point R3 1.2805


Disclaimer: For information purposes only. Past performance is not indicative of future results.
placeholder
Finding The Best Japan Stocks to Buy? These are Top Japanese Companies to Watch Discover the best Japanese stocks to buy, including AI semiconductor leaders, Buffett-backed trading houses, and undervalued Japan stocks benefiting from corporate reforms and yen trends.
Author  Mitrade
May 29, Fri
Discover the best Japanese stocks to buy, including AI semiconductor leaders, Buffett-backed trading houses, and undervalued Japan stocks benefiting from corporate reforms and yen trends.
placeholder
WTI rises to near $93.00 as Iran launches missiles toward Kuwait, BahrainWest Texas Intermediate (WTI) gains ground for the third successive day, trading around $92.90 per barrel during the Asian hours on Wednesday.
Author  FXStreet
Jun 03, Wed
West Texas Intermediate (WTI) gains ground for the third successive day, trading around $92.90 per barrel during the Asian hours on Wednesday.
placeholder
Forex Today: US Dollar stays resilient ahead of key US dataHere is what you need to know on Wednesday, June 3:
Author  FXStreet
Jun 03, Wed
Here is what you need to know on Wednesday, June 3:
placeholder
Bitcoin drops below $65K amid reinforced bear market signalsBitcoin (BTC) dipped further below $65,000 on Wednesday, with onchain data from Glassnode signaling a market firmly in a bear phase. The decline has pushed prices back into a key valuation range between the Realized Price and the True Market Mean.
Author  FXStreet
Jun 04, Thu
Bitcoin (BTC) dipped further below $65,000 on Wednesday, with onchain data from Glassnode signaling a market firmly in a bear phase. The decline has pushed prices back into a key valuation range between the Realized Price and the True Market Mean.
placeholder
Gold declines below $4,500 on stalled US-Iran ceasefire talks, US NFP data loomsGold price (XAU/USD) edges lower to near $4,470 during the early Asian session on Friday. The precious metal remains volatile amid ongoing geopolitical turmoil. Traders will closely monitor the developments surrounding the US-Iran peace deal and the US May employment report later on Friday. 
Author  FXStreet
23 hours ago
Gold price (XAU/USD) edges lower to near $4,470 during the early Asian session on Friday. The precious metal remains volatile amid ongoing geopolitical turmoil. Traders will closely monitor the developments surrounding the US-Iran peace deal and the US May employment report later on Friday. 
Related Instrument
goTop
quote