GBP/USD Price Analysis: Rallies above 1.2800 as buyers gain momentum

Source Fxstreet
  • GBP/USD soared more than 0.70% on Wednesday, post-CPI, ahead of FOMC’s decision.
  • Key technical resistance lies at YTD highs of 1.2893, 1.2900, and the 1.3000 figure.
  • Sellers must push prices beneath 1.2800, to remain hopeful of lower prices.

The Pound Sterling recovered some ground versus the US Dollar in early trading on Wednesday after the US Department of Labor revealed that inflation is cooling in the United States. This development happened ahead of the Federal Reserve's monetary policy decision, which would be followed by Fed Chair Jerome Powell's press conference. Therefore, the GBP/USD hit a two-month high and traded at 1.28434, gaining more than 0.70%.

GBP/USD Price Analysis: Technical outlook

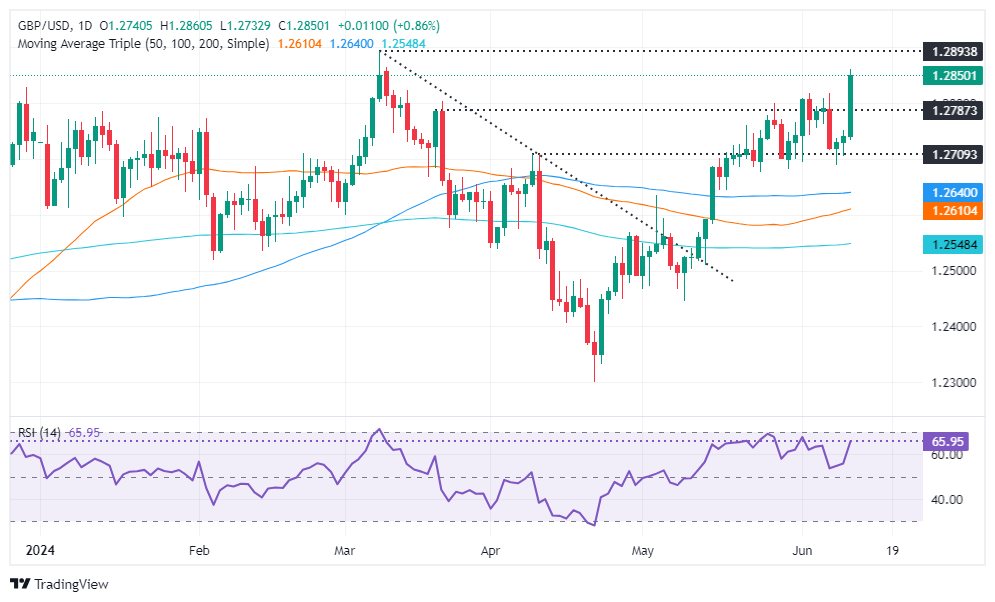
The GBP/USD remains upward biased, and after the US inflation data, has broken to new two-month highs, with just the year-to-date (YTD) high lying ahead at 1.2893. Once cleared, the next stop would be 1.3000 before challenging last year's high of 1.3142.

Momentum shifts strongly bullish, as depicted by the Relative Strength Index (RSI), which aims upward toward becoming overbought. Yet it remains shy of the highest RSI peak of 72.

If sellers want to regain control, they must drag the GBP/USD below 1.2800. Once surpassed, the next support would be 1.2750, ahead of the current week’s low of 1.2687.

GBP/USD Price Action – Daily Chart
GBP/USD

Overview
Today last price 1.2853
Today Daily Change 0.0113
Today Daily Change % 0.89
Today daily open 1.274
 
Trends
Daily SMA20 1.2734
Daily SMA50 1.2606
Daily SMA100 1.2639
Daily SMA200 1.2547
 
Levels
Previous Daily High 1.2752
Previous Daily Low 1.2706
Previous Weekly High 1.2818
Previous Weekly Low 1.2695
Previous Monthly High 1.2801
Previous Monthly Low 1.2446
Daily Fibonacci 38.2% 1.2734
Daily Fibonacci 61.8% 1.2723
Daily Pivot Point S1 1.2713
Daily Pivot Point S2 1.2687
Daily Pivot Point S3 1.2668
Daily Pivot Point R1 1.2759
Daily Pivot Point R2 1.2778
Daily Pivot Point R3 1.2805


British Pound PRICE Today

The table below shows the percentage change of British Pound (GBP) against listed major currencies today. British Pound was the strongest against the US Dollar.

  USD EUR GBP JPY CAD AUD NZD CHF
USD   -0.98% -0.86% -0.81% -0.56% -1.36% -1.22% -0.76%
EUR 0.98%   0.12% 0.14% 0.39% -0.40% -0.24% 0.23%
GBP 0.86% -0.12%   0.04% 0.29% -0.49% -0.34% 0.10%
JPY 0.81% -0.14% -0.04%   0.24% -0.55% -0.40% 0.05%
CAD 0.56% -0.39% -0.29% -0.24%   -0.80% -0.63% -0.20%
AUD 1.36% 0.40% 0.49% 0.55% 0.80%   0.16% 0.63%
NZD 1.22% 0.24% 0.34% 0.40% 0.63% -0.16%   0.44%
CHF 0.76% -0.23% -0.10% -0.05% 0.20% -0.63% -0.44%  

The heat map shows percentage changes of major currencies against each other. The base currency is picked from the left column, while the quote currency is picked from the top row. For example, if you pick the British Pound from the left column and move along the horizontal line to the US Dollar, the percentage change displayed in the box will represent GBP (base)/USD (quote).


Disclaimer: For information purposes only. Past performance is not indicative of future results.
placeholder
Ethereum Edges Toward Long-Term Holders’ Cost Basis, Now Only 8% Above Key Accumulation LevelEthereum is trading near $3,150 and just 8% above a key $2,895 long-term holders’ cost basis, with on-chain flows, macro uncertainty and support around $3,000–$2,800 all shaping what comes next for ETH.
Author  Mitrade
Nov 18, Tue
Ethereum is trading near $3,150 and just 8% above a key $2,895 long-term holders’ cost basis, with on-chain flows, macro uncertainty and support around $3,000–$2,800 all shaping what comes next for ETH.
placeholder
Top 3 Price Prediction: Bitcoin, Ethereum, Ripple – BTC, ETH and XRP Look for a Foothold After a Sharp ShakeoutBitcoin trades near $92,600 after a dip below $90,000, while Ethereum around $3,118 and XRP near $2.21–$2.23 sit on key support zones, as BTC, ETH and XRP all try to turn a sharp correction into a tradable rebound rather than a deeper slide.
Author  Mitrade
Nov 19, Wed
Bitcoin trades near $92,600 after a dip below $90,000, while Ethereum around $3,118 and XRP near $2.21–$2.23 sit on key support zones, as BTC, ETH and XRP all try to turn a sharp correction into a tradable rebound rather than a deeper slide.
placeholder
Could XRP Really Catch Ethereum? Analysts Revisit the Question as ETF Tailwinds BuildAs US spot XRP ETFs roll out and issuers like Canary Capital and Franklin Templeton step in, analysts say XRP’s market cap could climb on growing utility and ETF accumulation—but overtaking Ethereum’s $373 billion smart-contract powerhouse remains a long-shot, at least for now.
Author  Mitrade
Nov 20, Thu
As US spot XRP ETFs roll out and issuers like Canary Capital and Franklin Templeton step in, analysts say XRP’s market cap could climb on growing utility and ETF accumulation—but overtaking Ethereum’s $373 billion smart-contract powerhouse remains a long-shot, at least for now.
placeholder
Market Meltdown: BTC, ETH, and XRP Capitulate as Bears Seize ControlBitcoin trades around $85,900 after breaking below $86,000, with Ethereum under $2,791 and XRP below $1.99 as BTC, ETH and XRP extend weekly losses of 8–10%, forcing traders to focus on supports at $85,000, $2,749 and $1.77 for clues on whether this sell-off has further to run.
Author  Mitrade
Nov 21, Fri
Bitcoin trades around $85,900 after breaking below $86,000, with Ethereum under $2,791 and XRP below $1.99 as BTC, ETH and XRP extend weekly losses of 8–10%, forcing traders to focus on supports at $85,000, $2,749 and $1.77 for clues on whether this sell-off has further to run.
placeholder
Bitcoin Volatility Spikes: Is Options-Driven Pricing Making a Comeback?Bitcoin's volatility is surging, suggesting a shift back to options-driven price action seen before Bitcoin ETFs were launched.
Author  Mitrade
2 hours ago
Bitcoin's volatility is surging, suggesting a shift back to options-driven price action seen before Bitcoin ETFs were launched.
goTop
quote