EUR/JPY Price Analysis: Cross gains ground with subtle consolidation signs

Source Fxstreet
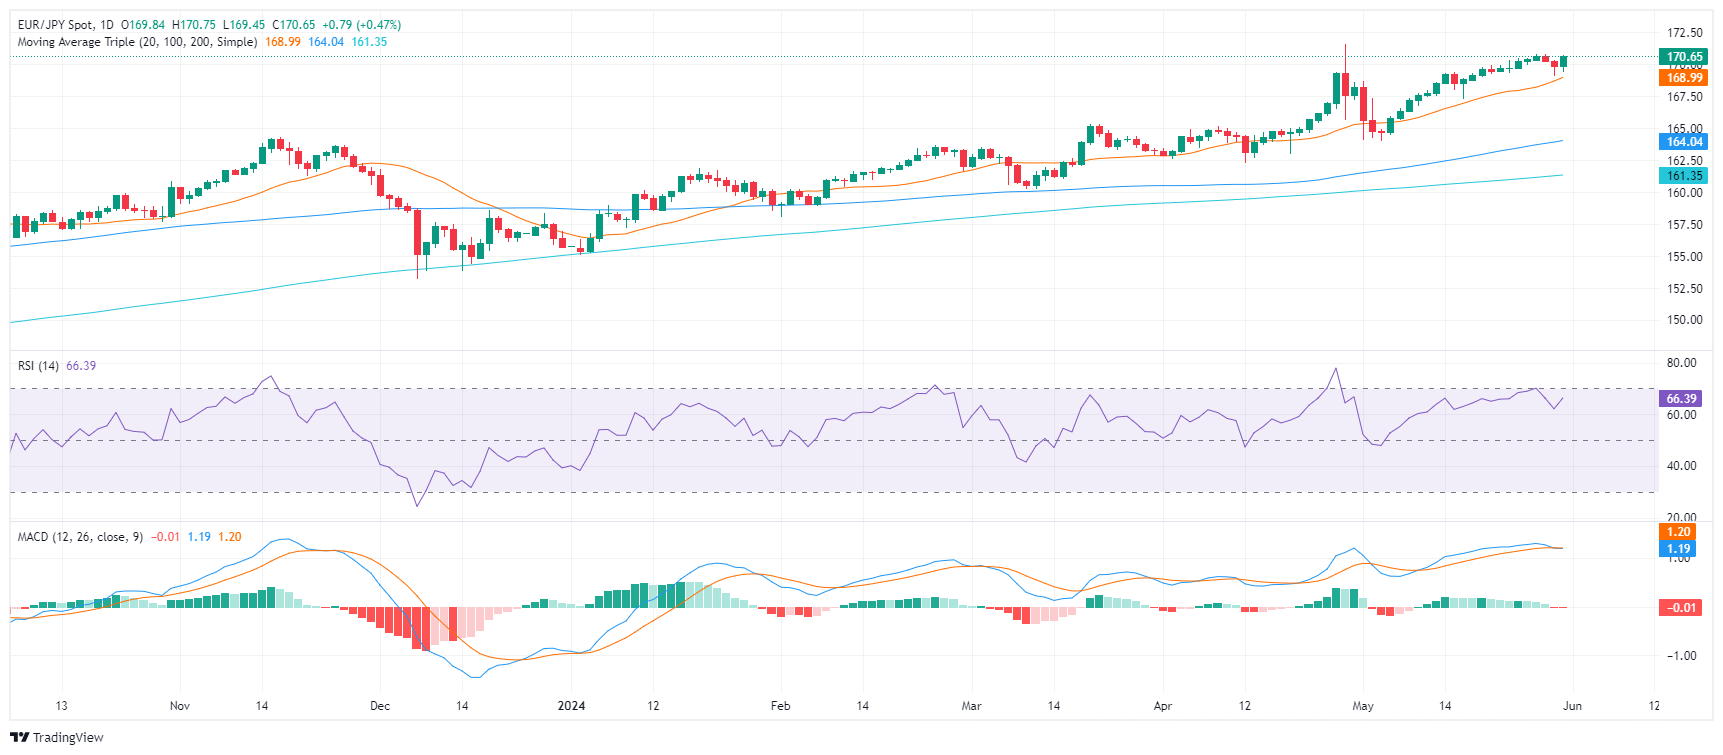
  • The daily RSI is pointing upwards, hovering around 70, but continuing red bars in the MACD show a trailing consolidation.
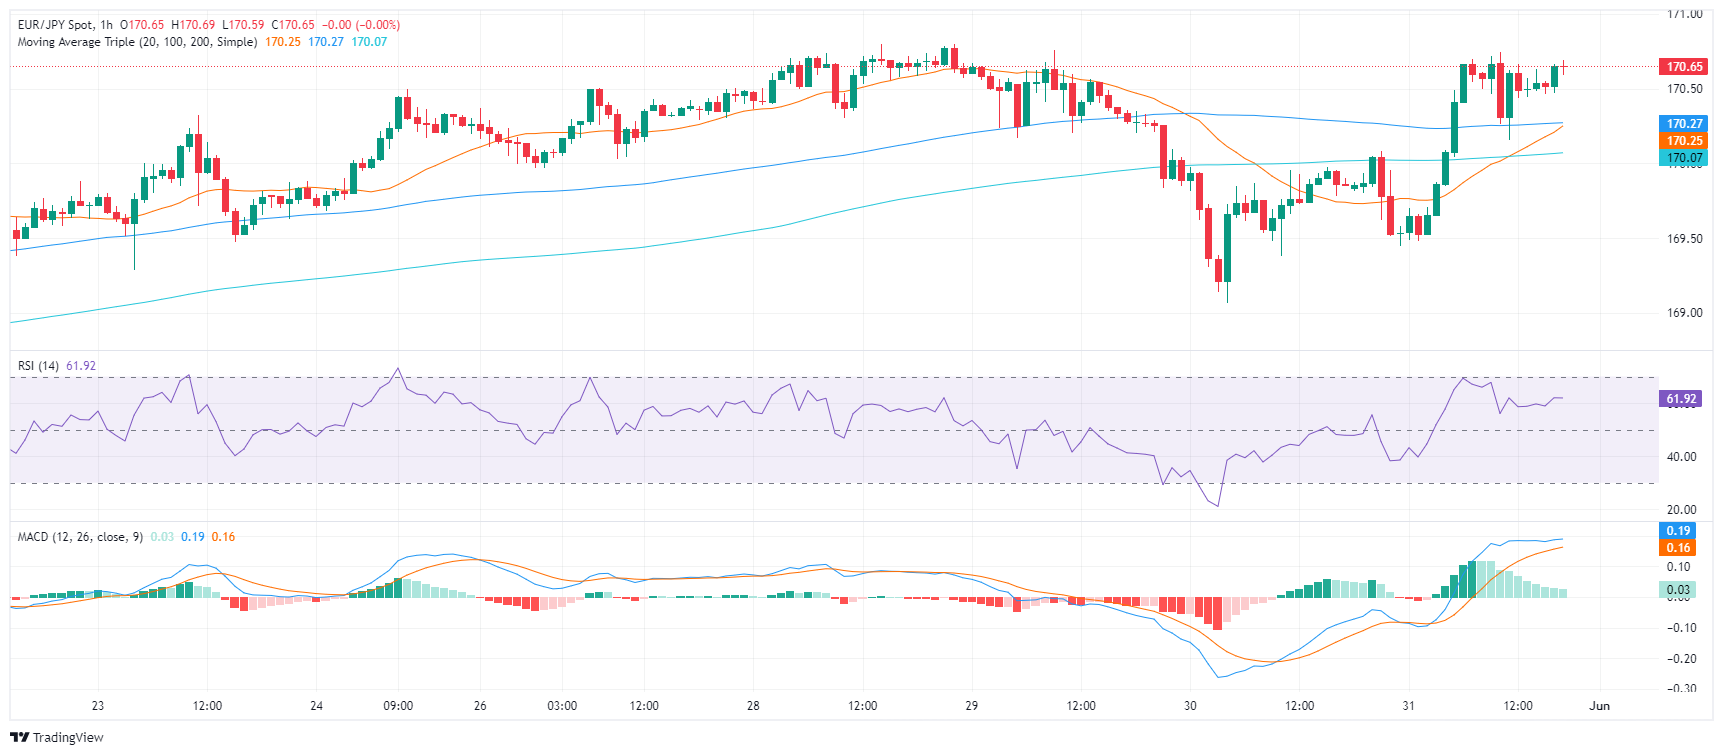
  • On the hourly chart, indicators are neutral and reside in the positive terrain.
  • The 20-day SMA at 169.00 serves as an important threshold for sellers.

On Friday's trading session, despite recent downside corrections, the EUR/JPY pair managed to reclaim its stance above 170.00. This indicates a shifting of the bearish momentum observed on Thursday when the pair marked a daily low at 169.00.

The daily Relative Strength Index (RSI) has pivoted, now pointing upwards near 70, suggesting a possible reversal. However, the MACD is still printing red bars, confirming that the pair is in a consolidation phase with limited upside. These mixed signals necessitate following the pair closely to determine if this marks a fresh bullish momentum or merely a pause in a more pronounced downward correction.

EUR/JPY daily chart

On the hourly chart, indicators are maintaining their neutrality, inhabiting the positive territory. This could potentially point to a subtle strengthening of bullish sentiment despite the ongoing consolidation phase.

EUR/JPY hourly chart

Critically, the position of the EUR/JPY pair continues to hover above the significant SMAs. The 20-day SMA at 169.00 in particular stands out as a crucial threshold and sellers must conquer this level to flip the near-term bullish outlook. Should the position fall below this key support level, the 100 and 200-day SMAs provide further safety barriers for potential sellers.

Disclaimer: For information purposes only. Past performance is not indicative of future results.
placeholder
Natural Gas sinks to pivotal level as China’s demand slumpsNatural Gas price (XNG/USD) edges lower and sinks to $2.56 on Monday, extending its losing streak for the fifth day in a row. The move comes on the back of China cutting its Liquified Natural Gas (LNG) imports after prices rose above $3.0 in June. It
Author  FXStreet
Jul 01, 2024
Natural Gas price (XNG/USD) edges lower and sinks to $2.56 on Monday, extending its losing streak for the fifth day in a row. The move comes on the back of China cutting its Liquified Natural Gas (LNG) imports after prices rose above $3.0 in June. It
placeholder
Ethereum (ETH) Price Closes Above $3,900 — Is a New All-Time High Possible Before 2024 Ends?Once again, the price of Ethereum (ETH) has risen above $3,900. This bounce has hinted at a further price increase for the altcoin before the end of the year.
Author  Beincrypto
Dec 17, 2024
Once again, the price of Ethereum (ETH) has risen above $3,900. This bounce has hinted at a further price increase for the altcoin before the end of the year.
placeholder
Pi Network Price Annual Forecast: PI Heads Into a Volatile 2026 as Utility Questions Collide With Big UnlocksPi Network heads into 2026 after a 90%+ 2025 drawdown from $3.00, with 17.5 million KYC users and a smart-contract-focused Stellar v23 upgrade offering upside potential, but 1.21 billion tokens unlocking and heavy exchange deposits (437 million PI) keeping supply pressure and trust risks firmly in focus.
Author  Mitrade
Dec 19, 2025
Pi Network heads into 2026 after a 90%+ 2025 drawdown from $3.00, with 17.5 million KYC users and a smart-contract-focused Stellar v23 upgrade offering upside potential, but 1.21 billion tokens unlocking and heavy exchange deposits (437 million PI) keeping supply pressure and trust risks firmly in focus.
placeholder
ECB Policy Outlook for 2026: What It Could Mean for the Euro’s Next MoveWith the ECB likely holding rates steady at 2.15% and the Fed potentially extending cuts into 2026, EUR/USD may test 1.20 if Eurozone growth proves resilient, but weaker growth and an ECB pivot could pull the pair back toward 1.13 and potentially 1.10.
Author  Mitrade
Dec 26, 2025
With the ECB likely holding rates steady at 2.15% and the Fed potentially extending cuts into 2026, EUR/USD may test 1.20 if Eurozone growth proves resilient, but weaker growth and an ECB pivot could pull the pair back toward 1.13 and potentially 1.10.
placeholder
WTI recovers to near $86.50 as Strait of Hormuz remains closedWest Texas Intermediate (WTI), the US crude oil benchmark, is trading around $86.40 during the early Asian trading hours on Tuesday. The WTI price faces extreme volatility following a massive spike to nearly $120 per barrel in the previous session. 
Author  FXStreet
Mar 10, Tue
West Texas Intermediate (WTI), the US crude oil benchmark, is trading around $86.40 during the early Asian trading hours on Tuesday. The WTI price faces extreme volatility following a massive spike to nearly $120 per barrel in the previous session. 
Related Instrument
goTop
quote