USD/CHF plummets following PCE data

Source Fxstreet
  • USD/CHF took a downturn in Friday’s session, plummeting to 0.9016, after slightly rising to 0.9070 earlier in the session.
  • Following US inflation figures coming in line with market expectations, markets may be anticipating a less aggressive Fed stance.
  • The potential for rate cuts in September has increased slightly.

The USD/CHF pair is trading lower following the release of the latest US inflation data on Friday. This change came in despite inflation figures, signaled by the Personal Consumption Expenditures (PCE) Price Index, holding steady at 2.7% YoY in April which matched market expectations.

On the other hand, the Core PCE Price Index, excluding volatile food and energy prices, observed a 2.8% YoY rise, consistent with the analyst's estimate. What seems to be weakening the USD is the lower-than-expected monthly variation of 0.2% which was below the 0.3% expected. The odds for easing by the Federal Reserve (Fed), however, remained mostly unchanged, except for a slight increase in the likelihood of the first-rate cut occurring in September. Those probabilities remain low for June and July.

USD/CHF technical analysis

In the daily analysis, the Relative Strength Index (RSI) has plunged into negative territory, indicating a momentum shift that favors sellers for the time being. Simultaneously, the Moving Average Convergence Divergence (MACD) displays red bars, pointing toward a growing bearish momentum.

USD/CHF daily chart

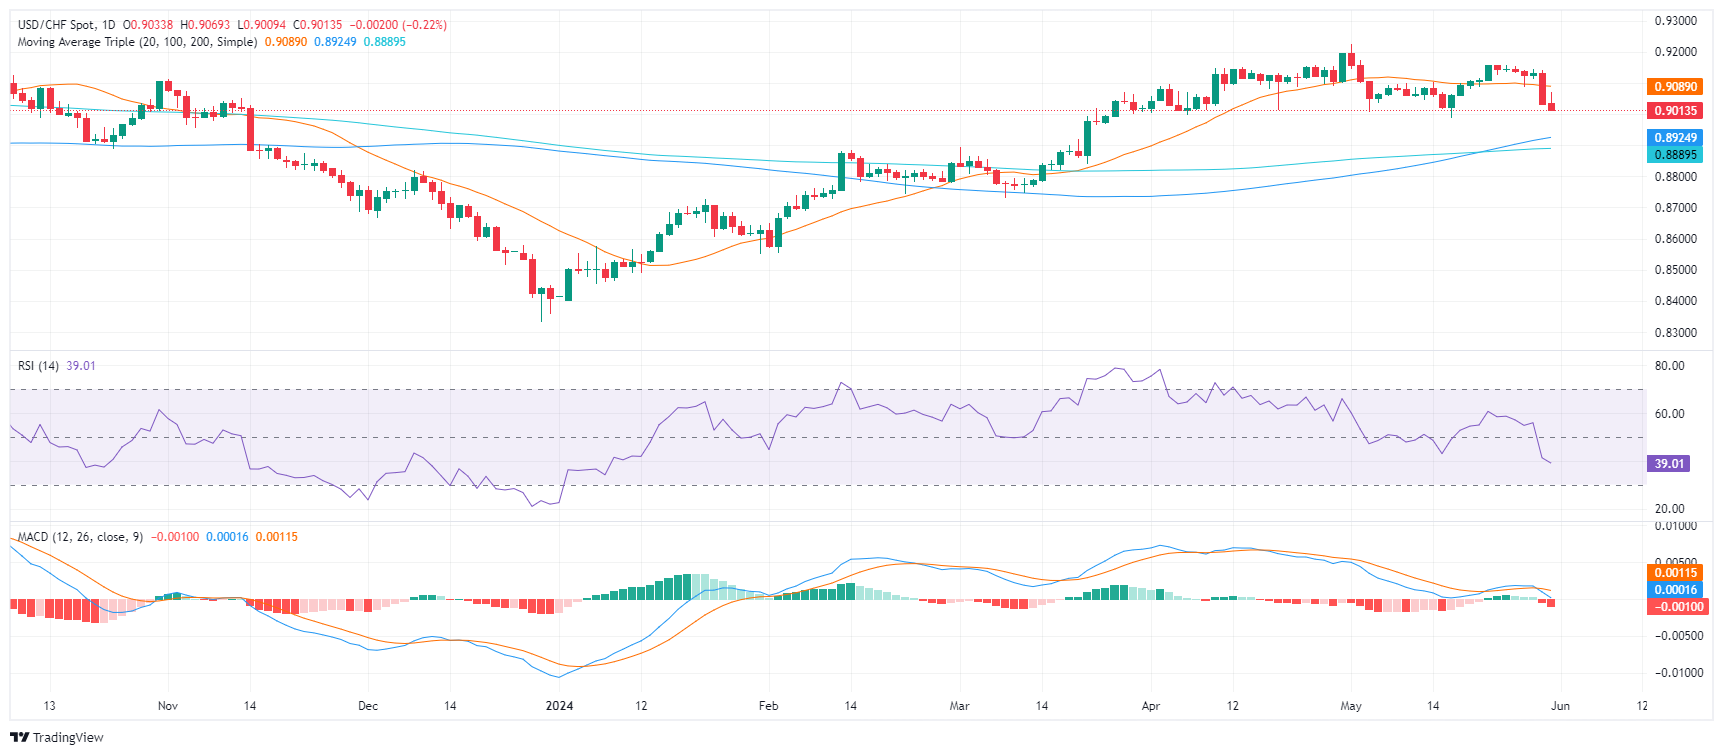
The USD/CHF seems to have lost some of its sheen from earlier in the week, when it stayed above the 20, 100, and 200-day Simple Moving Averages (SMAs). This previous positioning was a strong indicator of a bullish trend, with market dominance leaning towards buyers. However, following the recent downturn, the pair has lost its position above the 20-day SMA at 0.9095, indicating a less positive short-term outlook.

USD/CHF

Overview
Today last price 0.9023
Today Daily Change -0.0011
Today Daily Change % -0.12
Today daily open 0.9034
 
Trends
Daily SMA20 0.9091
Daily SMA50 0.9087
Daily SMA100 0.892
Daily SMA200 0.8889
 
Levels
Previous Daily High 0.9141
Previous Daily Low 0.9031
Previous Weekly High 0.9158
Previous Weekly Low 0.9079
Previous Monthly High 0.9195
Previous Monthly Low 0.8998
Daily Fibonacci 38.2% 0.9073
Daily Fibonacci 61.8% 0.9099
Daily Pivot Point S1 0.8996
Daily Pivot Point S2 0.8959
Daily Pivot Point S3 0.8886
Daily Pivot Point R1 0.9106
Daily Pivot Point R2 0.9179
Daily Pivot Point R3 0.9216


Disclaimer: For information purposes only. Past performance is not indicative of future results.
placeholder
Markets in 2026: Will gold, Bitcoin, and the U.S. dollar make history again? — These are how leading institutions thinkAfter a turbulent 2025, what lies ahead for commodities, forex, and cryptocurrency markets in 2026?
Author  Insights
Dec 25, 2025
After a turbulent 2025, what lies ahead for commodities, forex, and cryptocurrency markets in 2026?
placeholder
Analyst Flags XRP as Market’s ‘Best Risk/Reward’ Play as Token Tests Critical $1.60 SupportCrypto analyst Scott Melker identifies a prime risk/reward setup for XRP as it tests key support at $1.60, offering a tight stop-loss against potential upside targets near $2.00.
Author  Mitrade
Feb 03, Tue
Crypto analyst Scott Melker identifies a prime risk/reward setup for XRP as it tests key support at $1.60, offering a tight stop-loss against potential upside targets near $2.00.
placeholder
Ethereum Price Forecast: ETH faces heavy distribution as price slips below average cost basis of investorsEthereum (ETH) extended its decline on Wednesday, dropping more than 5% over the past 24 hours toward the $2,100 level, which is below the $2,310 average cost basis or realized price of investors, according to CryptoQuant's data.
Author  FXStreet
Yesterday 01: 53
Ethereum (ETH) extended its decline on Wednesday, dropping more than 5% over the past 24 hours toward the $2,100 level, which is below the $2,310 average cost basis or realized price of investors, according to CryptoQuant's data.
placeholder
Bitcoin Leverage Flush Evaporates $775M as Capital Rotates Into Defensive Infra PlaysBitcoin's plunge to $70K triggers a $775M leverage washout, driving a capital rotation into quantum-secure infrastructure project BMIC as investors seek uncorrelated alpha.
Author  Mitrade
Yesterday 08: 33
Bitcoin's plunge to $70K triggers a $775M leverage washout, driving a capital rotation into quantum-secure infrastructure project BMIC as investors seek uncorrelated alpha.
placeholder
Bitcoin’s Drop to $69K Wipes Out 15 Months of Bull Market GainsPrecious metals' volatility mirrored Bitcoin's downturn as it targets lower price points.
Author  Mitrade
Yesterday 08: 58
Precious metals' volatility mirrored Bitcoin's downturn as it targets lower price points.
Related Instrument
goTop
quote