USD/JPY is likely to remain underpinned by lack of options in Japan

Source Fxstreet
  • USD/JPY is likely to remain underpinned as the Bank of Japan has few options for sustainably strengthening the Yen. 
  • Direct intervention is only a quick fix and needs support from higher interest rates to work sustainably. 
  • The pair is likely to be a Dollar-affair with any declines resulting more from USD weakness rather than JPY strength. 

USD/JPY is likely to be a one-sided marriage with the US Dollar (USD) dominating the partnership, according to analysts. Any declines are likely to result from USD weakness rather than JPY strength

The Japanese authorities are being forced to take drastic measures to prop up their currency due to concerns about the negative impact of a too-weak Yen on Japanese businesses. The little strength the Yen has mustered in April and May has been due to direct intervention in the FX markets by the Bank of Japan (BoJ). 

Record interventions 

Data released by the BoJ this week shows it bought a record ¥9.8 trillion between April 29 and May 29 and intervened twice during this period – on April 29 and again on May 2. 

USD/JPY Daily Chart


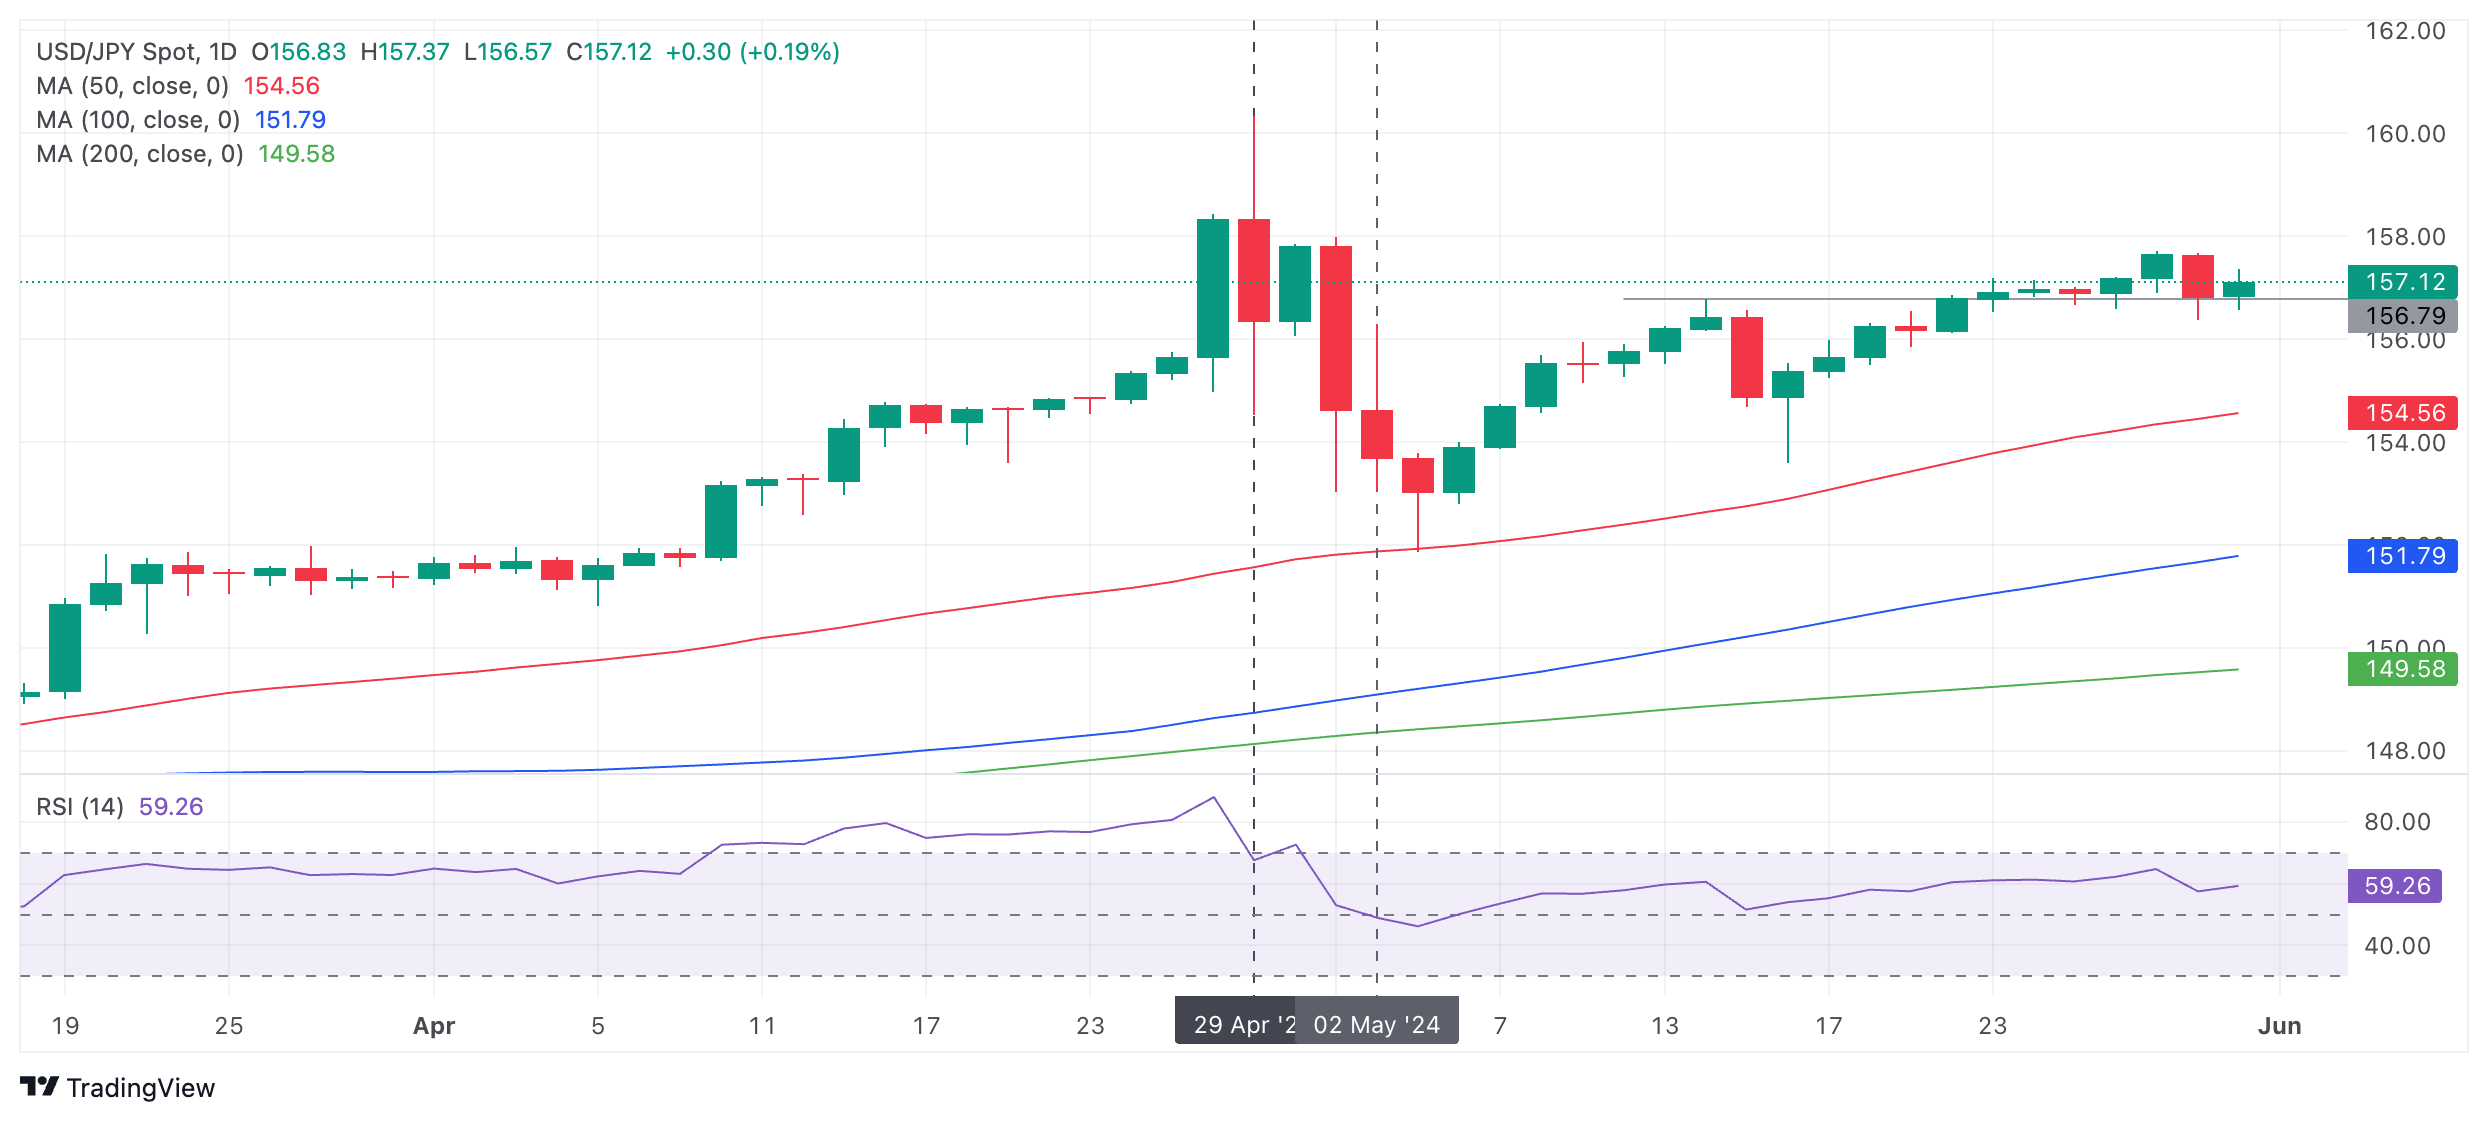
USD/JPY has steadily drifted higher since the May 3 low of 151.86 just after the BoJ’s second intervention, proving intervention only had a short-lived effect. 

To be truly longlasting direct intervention would need to be coupled with tighter BoJ policy, or higher interest rates. Higher interest rates make a currency more attractive to foreign investors as a place to park their capital, attracting greater inflows. 

“The second intervention drove USD/JPY from 158 down to 153, but the pair has since rebounded to trade near 157.30 currently. Until the BOJ outlines a more hawkish tightening cycle, the Yen is likely to remain weak.  That said, the interventions have stabilized the yen in a 155-160 range, at least for now,” say analysts at Brown Brothers Harriman (BBH) in a note on Friday. 

At between 0.0 - 0.1%, the base interest rate in Japan, set by the BoJ, is one of the lowest in the world. This explains the Yen’s persistent depreciation. Whilst inflation has risen sharply in most of the rest of the world post-Covid – resulting in most central banks putting up interest rates – in Japan this has not been the case. The result is the country’s currency has fallen like a stone. 

Bank of Japan board member Adachi Seiji said this week that the BoJ could raise interest rates purely to strengthen the Yen, however, analysts say this would be a mistake.  

“The rate hike could be seen as a mistake if it comes at a time when inflationary pressures are lacking and the economy is weak. The markets are already showing signs of nervousness — the implied volatility in options for the next two weeks has risen significantly as the period now includes the next Bank of Japan meeting,” says Volkmar Baur, FX Analyst at Commerzbank.

Raising interest rates too quickly could backfire on the BoJ, pushing inflation even lower and forcing them to retrace their steps, only delaying inevitable Yen weakness for later. 

BoJ is running out of options

The Japanese Yen (JPY) is limited in how much it can appreciate because the economic conditions in Japan do not warrant the Bank of Japan (BoJ) raising its policy rate. The BoJ is “running out of arguments” according to Baur. 

“The Bank of Japan has a problem. It continues to signal that it wants another rate hike. However, it also seems to be running low on convincing arguments. Although inflation in the Tokyo area rose in May, data released this morning showed that the increase was mainly due to higher energy prices..” says Baur in a recent note. 

Although headline inflation in the Tokyo area rose in May suggesting the same for the rest of the country, core inflation in the capital (ex food and energy) actually cooled from 1.4% to 1.3%, keeping it well below the BoJ’s 2.0% inflation target. 

Nor are the results of Shunto (translated as “spring wage offensive”) wage negotiations between unions and employers, scheduled for release in the Monthly Labor Survey for April next week, likely to impress markets that earnings are increasing sufficiently to drive up inflation. 

“Our Chief Japan economist estimates that only around half of companies should have incorporated the Shunto revisions into actual wages as of April,” says Galina Pozdnyakova, Research Analyst at Deutsche Bank. 

All-in-all the future looks bleak for the Yen and it may be that Japanese currency officials will have to rely on serendipity and the US Dollar to relieve the pressure, rather than the Japanese economy.  

Disclaimer: For information purposes only. Past performance is not indicative of future results.
placeholder
U.S. November Nonfarm Payrolls: What Does the Rare "Weak Jobs, Strong Economy" Mix Mean for U.S. Equities?1. IntroductionAfter retreating from the late-October highs, U.S. equities embarked on a bottoming rebound in mid-to-late November, a trend driven by the interplay of multiple factors. That said, it i
Author  TradingKey
8 hours ago
1. IntroductionAfter retreating from the late-October highs, U.S. equities embarked on a bottoming rebound in mid-to-late November, a trend driven by the interplay of multiple factors. That said, it i
placeholder
Senate Delays Crypto Market Structure Hearings to Early 2026The Senate Banking Committee has postponed cryptocurrency market structure hearings until 2026, citing ongoing bipartisan negotiations.
Author  Mitrade
12 hours ago
The Senate Banking Committee has postponed cryptocurrency market structure hearings until 2026, citing ongoing bipartisan negotiations.
placeholder
Bitcoin Slides 5% as Sellers Lean In — Can BTC Reclaim $88,000?Bitcoin has dropped back below $88,000 after rolling over from $90,500, with price still trading under the 100-hour Simple Moving Average. The sell-off found a floor at $85,151, and BTC is now consolidating near that base, but rebounds are facing pressure from a bearish trend line around $89,000. Bulls need to retake $88,000–$89,000 to ease downside risk; failure to do so keeps $85,500–$85,000 and then $83,500 in play, with $80,000 as the deeper “line in the sand.” Bitcoin (BTC) is back in damage-control mode after a sharp pullback wiped out recent gains. The price failed to reclaim the $90,000–$90,500 band, rolled over, and slid through $88,500 before briefly dipping under $87,000. Buyers did show up around $85,000, but the rebound so far looks more like stabilization than a clear trend reversal. Bitcoin dips hard, finds a bid near $85,000(h3) BTC’s latest move lower began when it couldn’t build follow-through above $90,000 and $90,500. Once that upside stalled, sellers took control and pushed price down through $88,500. The slide accelerated enough to spike below $87,000, but the market didn’t free-fall. Bulls defended the $85,000 zone, printing a low at $85,151. Since then, Bitcoin has been consolidating below the 23.6% Fibonacci retracement of the drop from the $93,560 swing high to the $85,151 low — a clue that the bounce is still shallow and that sellers haven’t fully backed off yet. Structurally, BTC is still on the back foot: It’s trading below $88,000, and It remains below the 100-hour Simple Moving Average, keeping short-term trend pressure pointed downward. Resistance is layered, and $89,000 is the problem area(h3) If bulls try to turn this into a recovery, they’ll have to climb through multiple ceilings in quick succession. First, BTC faces resistance around $87,150, followed by a more meaningful barrier near $87,500. From there, the market’s attention snaps back to $88,000 — the level BTC just lost and now needs to reclaim. A close back above $88,000 would improve the tone, but it doesn’t solve the bigger issue: there’s a bearish trend line on the hourly BTC/USD chart (Kraken feed) with resistance near $89,000, which also lines up with the next technical hurdle. If BTC can push through $89,000 and hold, the rebound could extend toward $90,000, with follow-through targets at $91,000 and $91,500. But until price clears that $88,000–$89,000 zone, rallies are at risk of being sold rather than chased. If BTC fails to reclaim resistance, the downside path is clear(h3) The near-term bear case is simple: if Bitcoin can’t climb back above the $87,000 area and keep traction, sellers may attempt another leg lower. Support levels line up like this: Immediate support: $85,500 First major support: $85,000 Next support: $83,500 Then $82,500 in the near term Below that, the major “don’t break this” level is still $80,000. If BTC slips under $80,000, the risk of acceleration to the downside increases significantly — not because it’s magic, but because it’s the kind of psychological and structural level that tends to trigger forced de-risking. Indicators: momentum still leans bearish(h3) The intraday indicators aren’t offering much comfort yet: Hourly MACD is losing pace in the bearish zone. Hourly RSI remains below 50, suggesting sellers still have the upper hand on short timeframes. So while the $85,000 defense held for now, the market hasn’t flipped bullish — it’s just stopped bleeding.
Author  Mitrade
15 hours ago
Bitcoin has dropped back below $88,000 after rolling over from $90,500, with price still trading under the 100-hour Simple Moving Average. The sell-off found a floor at $85,151, and BTC is now consolidating near that base, but rebounds are facing pressure from a bearish trend line around $89,000. Bulls need to retake $88,000–$89,000 to ease downside risk; failure to do so keeps $85,500–$85,000 and then $83,500 in play, with $80,000 as the deeper “line in the sand.” Bitcoin (BTC) is back in damage-control mode after a sharp pullback wiped out recent gains. The price failed to reclaim the $90,000–$90,500 band, rolled over, and slid through $88,500 before briefly dipping under $87,000. Buyers did show up around $85,000, but the rebound so far looks more like stabilization than a clear trend reversal. Bitcoin dips hard, finds a bid near $85,000(h3) BTC’s latest move lower began when it couldn’t build follow-through above $90,000 and $90,500. Once that upside stalled, sellers took control and pushed price down through $88,500. The slide accelerated enough to spike below $87,000, but the market didn’t free-fall. Bulls defended the $85,000 zone, printing a low at $85,151. Since then, Bitcoin has been consolidating below the 23.6% Fibonacci retracement of the drop from the $93,560 swing high to the $85,151 low — a clue that the bounce is still shallow and that sellers haven’t fully backed off yet. Structurally, BTC is still on the back foot: It’s trading below $88,000, and It remains below the 100-hour Simple Moving Average, keeping short-term trend pressure pointed downward. Resistance is layered, and $89,000 is the problem area(h3) If bulls try to turn this into a recovery, they’ll have to climb through multiple ceilings in quick succession. First, BTC faces resistance around $87,150, followed by a more meaningful barrier near $87,500. From there, the market’s attention snaps back to $88,000 — the level BTC just lost and now needs to reclaim. A close back above $88,000 would improve the tone, but it doesn’t solve the bigger issue: there’s a bearish trend line on the hourly BTC/USD chart (Kraken feed) with resistance near $89,000, which also lines up with the next technical hurdle. If BTC can push through $89,000 and hold, the rebound could extend toward $90,000, with follow-through targets at $91,000 and $91,500. But until price clears that $88,000–$89,000 zone, rallies are at risk of being sold rather than chased. If BTC fails to reclaim resistance, the downside path is clear(h3) The near-term bear case is simple: if Bitcoin can’t climb back above the $87,000 area and keep traction, sellers may attempt another leg lower. Support levels line up like this: Immediate support: $85,500 First major support: $85,000 Next support: $83,500 Then $82,500 in the near term Below that, the major “don’t break this” level is still $80,000. If BTC slips under $80,000, the risk of acceleration to the downside increases significantly — not because it’s magic, but because it’s the kind of psychological and structural level that tends to trigger forced de-risking. Indicators: momentum still leans bearish(h3) The intraday indicators aren’t offering much comfort yet: Hourly MACD is losing pace in the bearish zone. Hourly RSI remains below 50, suggesting sellers still have the upper hand on short timeframes. So while the $85,000 defense held for now, the market hasn’t flipped bullish — it’s just stopped bleeding.
placeholder
AUD/USD remains depressed below mid-0.6600s; downside seems limited ahead of US NFP reportThe AUD/USD pair attracts some sellers for the fourth straight day on Tuesday and trades around the 0.6630 region, down just over 0.10%, during the Asian session.
Author  FXStreet
16 hours ago
The AUD/USD pair attracts some sellers for the fourth straight day on Tuesday and trades around the 0.6630 region, down just over 0.10%, during the Asian session.
placeholder
Macro Analysts: Hawkish Japan Could Push Bitcoin Below $70KAnalysts predict Bitcoin may face further declines towards the $70,000 mark if the Bank of Japan raises interest rates as expected.
Author  Mitrade
Yesterday 05: 48
Analysts predict Bitcoin may face further declines towards the $70,000 mark if the Bank of Japan raises interest rates as expected.
goTop
quote