USD/JPY Price Analysis: Slips below 157.00 as bearish engulfing pattern looms

Source Fxstreet
  • USD/JPY slips from weekly highs of 157.71, down 0.30%.
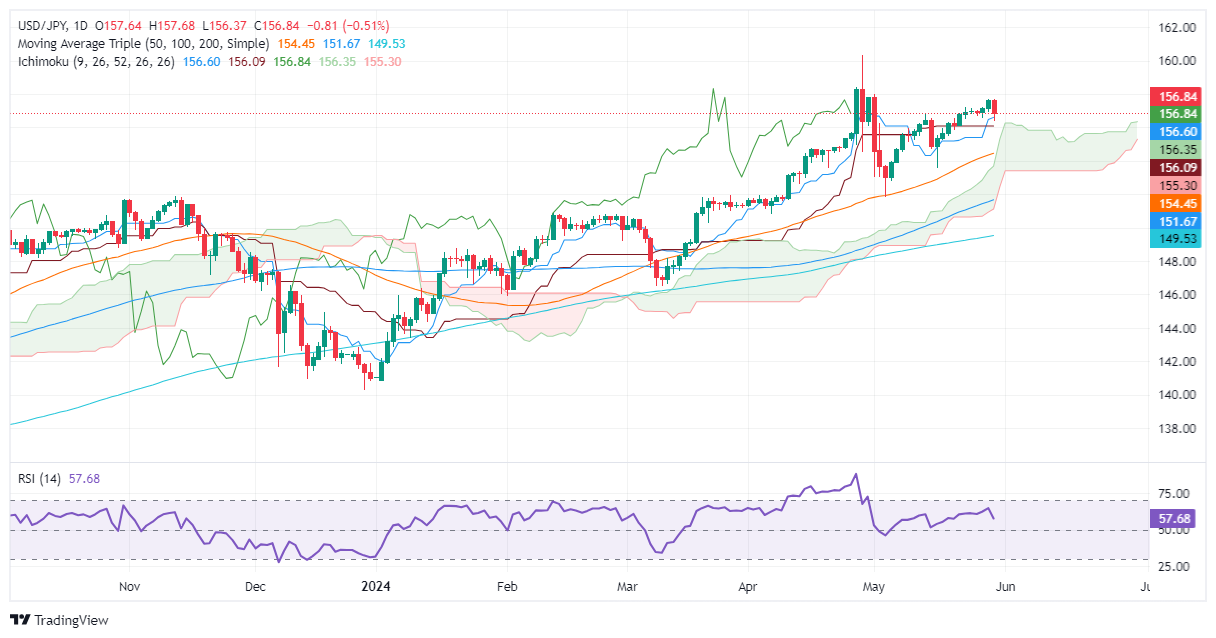
  • Technical outlook remains neutral to upward, with key resistance at 157.00 and 157.71.
  • Support levels to watch: Tenkan and Kijun-Sen at 156.76/60, Senkou Span A at 156.32, and 156.00 mark.

The USD/JPY dropped from weekly highs of 157.71 on May 29 after data from the United States (US) painted an ongoing economic slowdown, which sent US Treasury yields plunging. Consequently, the Greenback is feeling the pain, as the pair is trading at 156.83, down 0.30%.

USD/JPY Price Analysis: Technical outlook

The major remains neutral to upward bias after cracking the May 14 high of 156.76. That opened the door to challenge 157.00 and beyond, but the drop in the US 10-year yield, which correlates closely to the USD/JPY, weighed on the pair.

Momentum suggests that buyers remain in charge, as the Relative Strength Index (RSI) is bullish but aiming down.

If USD/JPY buyers reclaim 157.00, that could pave the way for further gains and expose overhead resistance at the current week’s high of 157.71. Once hurdled, the next stop would be 158.00, followed by the year-to-date (YTD) high of 160.32.

On the flip side, sellers could push the exchange rate as a ‘bearish engulfing’ chart pattern loom. A drop below the Tenkan and Kijun-Sen at around 156.76/60 will sponsor a leg down. The next line of defense for bulls would be the Senkou Span A at 156.32 before challenging the 156.00 mark.

USD/JPY Price Action – Daily Chart

USD/JPY

Overview
Today last price 156.82
Today Daily Change -0.83
Today Daily Change % -0.53
Today daily open 157.65
 
Trends
Daily SMA20 155.78
Daily SMA50 154.35
Daily SMA100 151.55
Daily SMA200 149.48
 
Levels
Previous Daily High 157.71
Previous Daily Low 156.9
Previous Weekly High 157.2
Previous Weekly Low 155.5
Previous Monthly High 160.32
Previous Monthly Low 150.81
Daily Fibonacci 38.2% 157.4
Daily Fibonacci 61.8% 157.21
Daily Pivot Point S1 157.13
Daily Pivot Point S2 156.61
Daily Pivot Point S3 156.32
Daily Pivot Point R1 157.94
Daily Pivot Point R2 158.23
Daily Pivot Point R3 158.75


Disclaimer: For information purposes only. Past performance is not indicative of future results.
placeholder
Gold Price Forecast: Gold Price Falls Below $4,000, PCE Data May Push Gold Down to $3,900As of today (June 25) during the Asian session, gold ( XAUUSD) was last priced at $3,976.90, down 0.54% on the day. After gold prices fell below $4,000 yesterday, they fluctuated around $
Author  TradingKey
14 hours ago
As of today (June 25) during the Asian session, gold ( XAUUSD) was last priced at $3,976.90, down 0.54% on the day. After gold prices fell below $4,000 yesterday, they fluctuated around $
placeholder
Crypto market sheds over 50% of its value amid Bitcoin's brief decline below $60KThe crypto market has erased more than half of its value since reaching an all-time high in late 2025. The decline underscores the severity of the recent bear market and lack of a fresh catalyst to revive investor interest, according to a Wednesday X post by The Kobeissi Letter.
Author  FXStreet
21 hours ago
The crypto market has erased more than half of its value since reaching an all-time high in late 2025. The decline underscores the severity of the recent bear market and lack of a fresh catalyst to revive investor interest, according to a Wednesday X post by The Kobeissi Letter.
placeholder
Gold Price Trend Forecast: Gold Price Risks Falling Below $4,000, PCE Data Is Key As of the European session today (June 24), gold prices ( XAUUSD) remained weak and fell intraday, touching an intraday low of $4,050 to hit a near two-week low, signaling clear short-ter
Author  TradingKey
Yesterday 09: 11
As of the European session today (June 24), gold prices ( XAUUSD) remained weak and fell intraday, touching an intraday low of $4,050 to hit a near two-week low, signaling clear short-ter
placeholder
$4,050: Gold dives to fresh two-week low as Fed rate hike bets boost US DollarGold (XAU/USD) drifts lower for the second straight day – also marking the fifth day of a negative move in the previous six – and drops to a nearly two-week low during the Asian session on Wednesday.
Author  FXStreet
Yesterday 06: 10
Gold (XAU/USD) drifts lower for the second straight day – also marking the fifth day of a negative move in the previous six – and drops to a nearly two-week low during the Asian session on Wednesday.
placeholder
WTI languishes near March lows, holds above mid-$72.00s amid easing supply concernsWest Texas Intermediate (WTI) – the benchmark US Crude Oil price – consolidates during the Asian session on Wednesday and currently trades just above mid-$72.00s, near its lowest level since early March, touched the previous day.
Author  FXStreet
Yesterday 01: 16
West Texas Intermediate (WTI) – the benchmark US Crude Oil price – consolidates during the Asian session on Wednesday and currently trades just above mid-$72.00s, near its lowest level since early March, touched the previous day.
Related Instrument
goTop
quote