AUD/JPY Price Analysis: Breaks below 104.00, followed by support at 14-day EMA

Source Fxstreet
  • AUD/JPY could test the key level of 104.00, followed by the upper boundary of the ascending triangle.
  • The momentum indicator 14-day RSI suggests the confirmation of the bullish bias for the pair.
  • The immediate support appears around the 14-day EMA at 103.63 and the lower threshold of the ascending triangle.

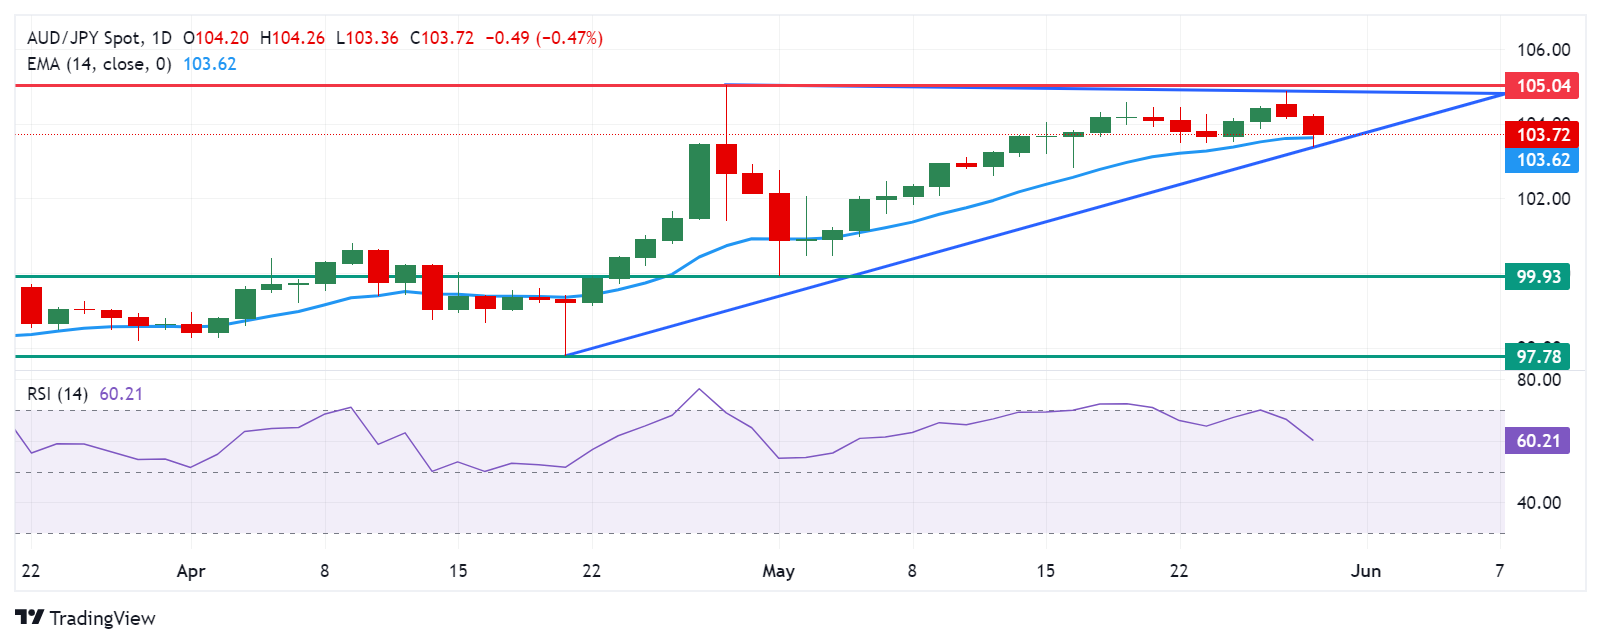
AUD/JPY extends its losses to near 103.80 during European trading hours on Thursday. However, the analysis of the daily chart indicates a bullish bias for the AUD/JPY pair, as it remains within an ascending triangle. Furthermore, the momentum indicator 14-day Relative Strength Index (RSI) is above the 50 level, suggesting confirmation of the bullish outlook.

The AUD/JPY cross could test the immediate resistance at the psychological level of 104.00, followed by the upper boundary of the ascending triangle around 104.80. A breakthrough above this level could reinforce the bullish sentiment, potentially pushing the cross past the psychological level of 105.00, aligning with the highest level of 105.04, which has not been seen since April 2013.

On the downside, the 14-day Exponential Moving Average (EMA) at 103.62 serves as immediate support for the AUD/JPY cross, followed by the lower threshold of the ascending triangle around the key level of 103.50.

A break below the latter could lead the AUD/JPY cross to navigate the region around the psychological level of 100.00 and the throwback support at 99.93. Further decline could exert downward pressure on the cross, potentially driving it toward April's low of 97.78.

AUD/JPY: Daily Chart
AUD/JPY

Overview
Today last price 103.76
Today Daily Change -0.45
Today Daily Change % -0.43
Today daily open 104.21
 
Trends
Daily SMA20 103.28
Daily SMA50 101.24
Daily SMA100 99.41
Daily SMA200 97.65
 
Levels
Previous Daily High 104.87
Previous Daily Low 104.12
Previous Weekly High 104.56
Previous Weekly Low 103.48
Previous Monthly High 105.04
Previous Monthly Low 97.78
Daily Fibonacci 38.2% 104.4
Daily Fibonacci 61.8% 104.58
Daily Pivot Point S1 103.93
Daily Pivot Point S2 103.65
Daily Pivot Point S3 103.18
Daily Pivot Point R1 104.68
Daily Pivot Point R2 105.15
Daily Pivot Point R3 105.43


Disclaimer: For information purposes only. Past performance is not indicative of future results.
placeholder
Fed Officials Speak Out in Force to Back Rate Cut! December Cut Now a Done Deal? Will the FOMC Meeting Be Delayed?TradingKey - San Francisco Federal Reserve President Mary Daly has voiced support for a rate cut at next month's meeting, citing the greater likelihood and harder-to-manage risk of a sudden deteriorat
Author  TradingKey
11 hours ago
TradingKey - San Francisco Federal Reserve President Mary Daly has voiced support for a rate cut at next month's meeting, citing the greater likelihood and harder-to-manage risk of a sudden deteriorat
placeholder
Bitcoin Bleeds to $86K, But This Key Indicator Screams "The Top Isn't In"Bitcoin’s adjusted Spent Output Profit Ratio (aSOPR) has spent nearly two years coiling below the extremes seen at past bull-market peaks, even as BTC trades around $86,300 and down 9% on the week — a setup that leaves open the possibility that this cycle’s true top may still lie ahead.
Author  Mitrade
14 hours ago
Bitcoin’s adjusted Spent Output Profit Ratio (aSOPR) has spent nearly two years coiling below the extremes seen at past bull-market peaks, even as BTC trades around $86,300 and down 9% on the week — a setup that leaves open the possibility that this cycle’s true top may still lie ahead.
placeholder
Gold Price Forecast: XAU/USD rises to near $4,150 as Fed rate cut bets growGold price (XAU/USD) attracts some buyers to around $4,140 during the early Asian session on Tuesday. The precious metal rises on growing expectations of a US Federal Reserve (Fed) interest rate cut in the December policy meeting.
Author  FXStreet
19 hours ago
Gold price (XAU/USD) attracts some buyers to around $4,140 during the early Asian session on Tuesday. The precious metal rises on growing expectations of a US Federal Reserve (Fed) interest rate cut in the December policy meeting.
placeholder
U.S. Q3 Earnings Season Nears Close as Investors Eye Dell, HP Results.U.S. October PCE Price Index Released【The week ahead】TradingKey - Last week, concerns over an AI bubble, coupled with fading expectations for Federal Reserve rate cuts, triggered a broad sell-off in U.S. equities. The tech-heavy Nasdaq Composite (.IXIC.
Author  TradingKey
Yesterday 10: 18
TradingKey - Last week, concerns over an AI bubble, coupled with fading expectations for Federal Reserve rate cuts, triggered a broad sell-off in U.S. equities. The tech-heavy Nasdaq Composite (.IXIC.
placeholder
Top 3 Price Prediction: Bitcoin, Ethereum, Ripple – BTC, ETH and XRP Attempt Recovery Post-SelloffBitcoin trades back above $87,700 after a 20% drop, while Ethereum rebounds from support around $2,749 and XRP recovers above $2.08 off its $1.96 floor, as BTC, ETH and XRP all try to turn last week’s steep correction into the start of a broader recovery.
Author  Mitrade
Yesterday 05: 58
Bitcoin trades back above $87,700 after a 20% drop, while Ethereum rebounds from support around $2,749 and XRP recovers above $2.08 off its $1.96 floor, as BTC, ETH and XRP all try to turn last week’s steep correction into the start of a broader recovery.
goTop
quote