Japanese Yen appreciates as traders bet on another rate hike by BoJ

Source Fxstreet
  • The Japanese Yen gained ground after comments from BoJ board member Seiji Adachi on Wednesday.
  • Adachi suggested that it might be appropriate to raise rates if a weaker JPY leads to heightened inflation.
  • Hawkish remarks from Minneapolis Fed President Neel Kashkari fueled risk aversion sentiment, bolstering the US Dollar.

The Japanese Yen (JPY) snapped recent losses on Thursday, spurred by comments from Bank of Japan (BoJ) board member Seiji Adachi on Wednesday. Adachi emphasized the gradual reduction of bond purchases to ensure that long-term yields accurately reflect market signals. Additionally, he suggested that raising interest rates could be appropriate if a weaker JPY leads to increased inflation, per Reuters

Traders have increased bets on the Bank of Japan (BoJ) implementing another interest rate hike. Investors are now turning their attention to Tokyo's inflation data scheduled for release on Friday, which is seen as a key indicator of nationwide price trends.

Hawkish remarks from Minneapolis Fed President Neel Kashkari further fueled concerns about potential rate hikes, sustaining the significant yield gap between the US and Japan. This environment continues to foster JPY carry trades, where investors leverage low-interest Japanese Yen to invest in higher-yielding US Dollar assets.

The US Dollar (USD) strengthened on account of elevated US Treasury yields, partly driven by increased risk aversion ahead of the release of US Gross Domestic Product Annualized (Q1) data on Thursday. Additionally, market participants will likely observe the Core Personal Consumption Expenditures (PCE) Price Index data scheduled for Friday, which are anticipated to offer insights into the Federal Reserve's potential stance on interest rate adjustments.

Daily Digest Market Movers: Japanese Yen rebounds due to dovish comments from Fed’s Bostic

  • According to Bloomberg, Federal Reserve Bank of Atlanta President Raphael Bostic stated on Thursday that the path of inflation is expected to be uneven, and a decrease in inflation breadth would bolster confidence in the necessity of a rate cut.
  • On Wednesday, the Fed Beige Book report covering the period from April to mid-May showed that national economic activity experienced slight growth, with mixed conditions across industries and districts. The report also indicated that employment rose slightly, wage growth was moderate, and prices increased modestly as consumers resisted further price hikes.
  • Reuters reported that Neel Kashkari, President of the Federal Reserve Bank of Minneapolis, hinted at the possibility of a rate hike. Kashkari remarked, “I don’t believe anyone has completely ruled out the option of increasing rates,” expressing doubts about the disinflationary trend and projecting only two rate cuts.
  • On Tuesday, the US Housing Price Index (MoM) for March was underperforming, with March's number coming in at 0.1% against 1.2% for February, where 0.5% was expected.
  • Japan's Weighted Median Inflation Index, a significant gauge of the country’s trend inflation, increased by 1.1% in April. This growth rate represents a slowdown from the 1.3% increase recorded in March.
  • Japan’s Corporate Service Price Index (CSPI). The index posted a year-over-year reading of 2.8% in April, surpassing expectations of 2.3% and marking its fastest rate of increase since March 2015.
  • Japan Finance Minister Shun'ichi Suzuki on Tuesday, emphasized the importance of currencies moving in a stable manner that reflects fundamentals, stating that he is closely monitoring foreign exchange (FX) movements. However, Suzuki refrained from commenting on whether Japan has conducted currency intervention.

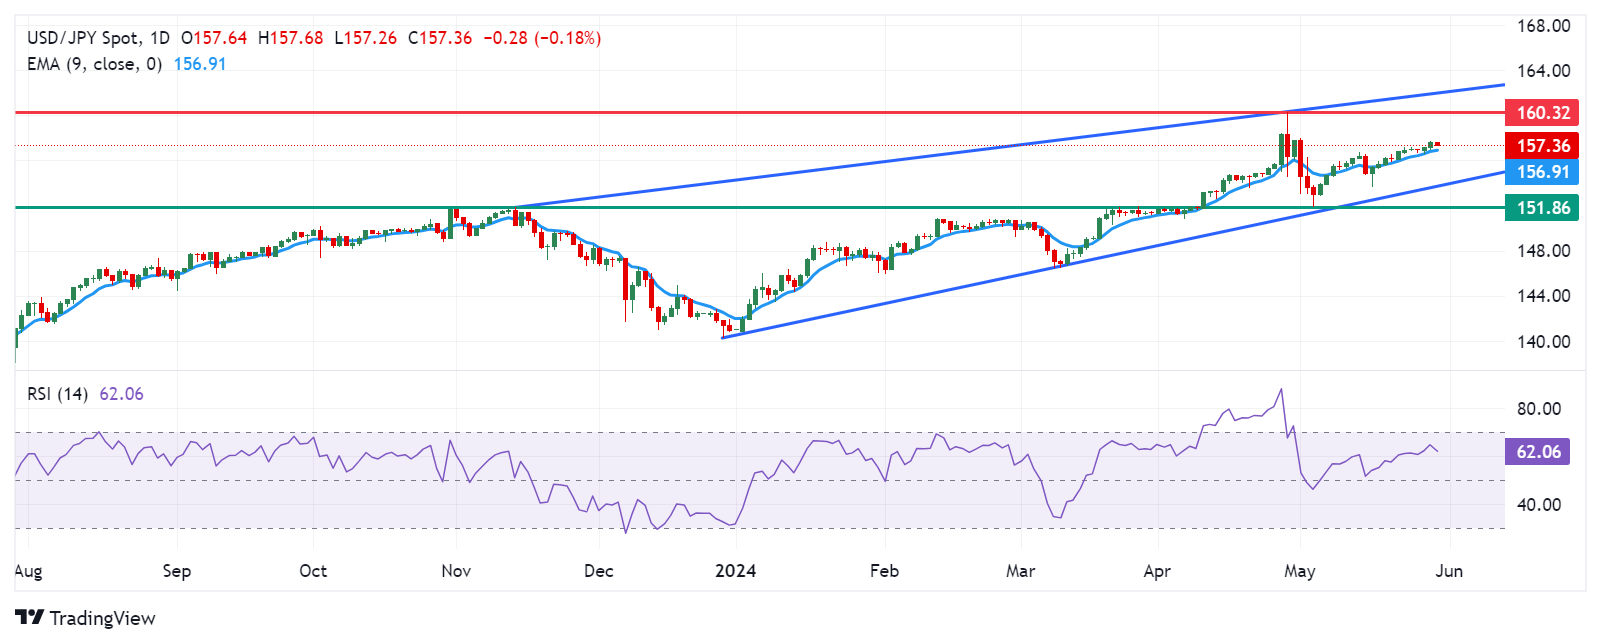
Technical Analysis: USD/JPY remains below 157.50

The USD/JPY pair trades around 157.30 on Thursday. The daily chart shows a rising channel pattern, indicating the continuation of an upward trend in the market. Additionally, the 14-day Relative Strength Index (RSI) remains above 50, confirming a bullish bias.

The USD/JPY pair may potentially test the psychological level of 158.00, which aligns with the upper boundary of the rising channel. If this level is breached, the next target could be 160.32, marking its highest point in over thirty years.

On the downside, the immediate support appears at the psychological level of 157.00, followed by the nine-day Exponential Moving Average (EMA) at 156.90. Further decline in the USD/JPY pair could apply downward pressure, potentially testing the lower boundary of the rising channel.

USD/JPY: Daily Chart

Japanese Yen price today

The table below shows the percentage change of the Japanese Yen (JPY) against listed major currencies today. Japanese Yen was the strongest against the New Zealand Dollar.

  USD EUR GBP CAD AUD JPY NZD CHF
USD   0.05% 0.04% 0.06% 0.10% -0.16% 0.15% 0.05%
EUR -0.05%   -0.01% 0.03% 0.04% -0.19% 0.11% -0.02%
GBP -0.03% 0.01%   0.04% 0.05% -0.19% 0.11% -0.01%
CAD -0.06% -0.01% -0.02%   0.03% -0.21% 0.10% -0.03%
AUD -0.09% -0.04% -0.05% -0.02%   -0.23% 0.08% -0.06%
JPY 0.14% 0.20% 0.17% 0.20% 0.25%   0.28% 0.17%
NZD -0.15% -0.11% -0.13% -0.09% -0.08% -0.31%   -0.15%
CHF -0.03% 0.02% 0.01% 0.04% 0.07% -0.18% 0.12%  

The heat map shows percentage changes of major currencies against each other. The base currency is picked from the left column, while the quote currency is picked from the top row. For example, if you pick the Euro from the left column and move along the horizontal line to the Japanese Yen, the percentage change displayed in the box will represent EUR (base)/JPY (quote).

Japanese Yen FAQs

The Japanese Yen (JPY) is one of the world’s most traded currencies. Its value is broadly determined by the performance of the Japanese economy, but more specifically by the Bank of Japan’s policy, the differential between Japanese and US bond yields, or risk sentiment among traders, among other factors.

One of the Bank of Japan’s mandates is currency control, so its moves are key for the Yen. The BoJ has directly intervened in currency markets sometimes, generally to lower the value of the Yen, although it refrains from doing it often due to political concerns of its main trading partners. The current BoJ ultra-loose monetary policy, based on massive stimulus to the economy, has caused the Yen to depreciate against its main currency peers. This process has exacerbated more recently due to an increasing policy divergence between the Bank of Japan and other main central banks, which have opted to increase interest rates sharply to fight decades-high levels of inflation.

The BoJ’s stance of sticking to ultra-loose monetary policy has led to a widening policy divergence with other central banks, particularly with the US Federal Reserve. This supports a widening of the differential between the 10-year US and Japanese bonds, which favors the US Dollar against the Japanese Yen.

The Japanese Yen is often seen as a safe-haven investment. This means that in times of market stress, investors are more likely to put their money in the Japanese currency due to its supposed reliability and stability. Turbulent times are likely to strengthen the Yen’s value against other currencies seen as more risky to invest in.


Disclaimer: For information purposes only. Past performance is not indicative of future results.
placeholder
Gold Price Forecast: XAU/USD drifts higher above $4,200 as Fed delivers expected cutGold price (XAU/USD) gains momentum to around $4,235 during the early Asian session on Thursday. The precious metal extends its upside after the US Federal Reserve (Fed) delivered an expected third consecutive interest rate cut and maintained its outlook for just one cut in 2026.
Author  FXStreet
Dec 11, Thu
Gold price (XAU/USD) gains momentum to around $4,235 during the early Asian session on Thursday. The precious metal extends its upside after the US Federal Reserve (Fed) delivered an expected third consecutive interest rate cut and maintained its outlook for just one cut in 2026.
placeholder
Ethereum Price Slips Lower — $3,000 Looms as the Key BattlegroundEthereum is attempting to recover from a $3,026 low but remains below $3,200 and the 100-hour SMA, with a bearish trend line near $3,175 capping rebounds as bulls need a clean break above $3,200 to target $3,250–$3,400, while a drop below $3,050 risks a retest of $3,000 and $2,940.
Author  Mitrade
Dec 15, Mon
Ethereum is attempting to recover from a $3,026 low but remains below $3,200 and the 100-hour SMA, with a bearish trend line near $3,175 capping rebounds as bulls need a clean break above $3,200 to target $3,250–$3,400, while a drop below $3,050 risks a retest of $3,000 and $2,940.
placeholder
Bitcoin Slides 5% as Sellers Lean In — Can BTC Reclaim $88,000?Bitcoin has dropped back below $88,000 after rolling over from $90,500, with price still trading under the 100-hour Simple Moving Average. The sell-off found a floor at $85,151, and BTC is now consolidating near that base, but rebounds are facing pressure from a bearish trend line around $89,000. Bulls need to retake $88,000–$89,000 to ease downside risk; failure to do so keeps $85,500–$85,000 and then $83,500 in play, with $80,000 as the deeper “line in the sand.” Bitcoin (BTC) is back in damage-control mode after a sharp pullback wiped out recent gains. The price failed to reclaim the $90,000–$90,500 band, rolled over, and slid through $88,500 before briefly dipping under $87,000. Buyers did show up around $85,000, but the rebound so far looks more like stabilization than a clear trend reversal. Bitcoin dips hard, finds a bid near $85,000(h3) BTC’s latest move lower began when it couldn’t build follow-through above $90,000 and $90,500. Once that upside stalled, sellers took control and pushed price down through $88,500. The slide accelerated enough to spike below $87,000, but the market didn’t free-fall. Bulls defended the $85,000 zone, printing a low at $85,151. Since then, Bitcoin has been consolidating below the 23.6% Fibonacci retracement of the drop from the $93,560 swing high to the $85,151 low — a clue that the bounce is still shallow and that sellers haven’t fully backed off yet. Structurally, BTC is still on the back foot: It’s trading below $88,000, and It remains below the 100-hour Simple Moving Average, keeping short-term trend pressure pointed downward. Resistance is layered, and $89,000 is the problem area(h3) If bulls try to turn this into a recovery, they’ll have to climb through multiple ceilings in quick succession. First, BTC faces resistance around $87,150, followed by a more meaningful barrier near $87,500. From there, the market’s attention snaps back to $88,000 — the level BTC just lost and now needs to reclaim. A close back above $88,000 would improve the tone, but it doesn’t solve the bigger issue: there’s a bearish trend line on the hourly BTC/USD chart (Kraken feed) with resistance near $89,000, which also lines up with the next technical hurdle. If BTC can push through $89,000 and hold, the rebound could extend toward $90,000, with follow-through targets at $91,000 and $91,500. But until price clears that $88,000–$89,000 zone, rallies are at risk of being sold rather than chased. If BTC fails to reclaim resistance, the downside path is clear(h3) The near-term bear case is simple: if Bitcoin can’t climb back above the $87,000 area and keep traction, sellers may attempt another leg lower. Support levels line up like this: Immediate support: $85,500 First major support: $85,000 Next support: $83,500 Then $82,500 in the near term Below that, the major “don’t break this” level is still $80,000. If BTC slips under $80,000, the risk of acceleration to the downside increases significantly — not because it’s magic, but because it’s the kind of psychological and structural level that tends to trigger forced de-risking. Indicators: momentum still leans bearish(h3) The intraday indicators aren’t offering much comfort yet: Hourly MACD is losing pace in the bearish zone. Hourly RSI remains below 50, suggesting sellers still have the upper hand on short timeframes. So while the $85,000 defense held for now, the market hasn’t flipped bullish — it’s just stopped bleeding.
Author  Mitrade
Dec 16, Tue
Bitcoin has dropped back below $88,000 after rolling over from $90,500, with price still trading under the 100-hour Simple Moving Average. The sell-off found a floor at $85,151, and BTC is now consolidating near that base, but rebounds are facing pressure from a bearish trend line around $89,000. Bulls need to retake $88,000–$89,000 to ease downside risk; failure to do so keeps $85,500–$85,000 and then $83,500 in play, with $80,000 as the deeper “line in the sand.” Bitcoin (BTC) is back in damage-control mode after a sharp pullback wiped out recent gains. The price failed to reclaim the $90,000–$90,500 band, rolled over, and slid through $88,500 before briefly dipping under $87,000. Buyers did show up around $85,000, but the rebound so far looks more like stabilization than a clear trend reversal. Bitcoin dips hard, finds a bid near $85,000(h3) BTC’s latest move lower began when it couldn’t build follow-through above $90,000 and $90,500. Once that upside stalled, sellers took control and pushed price down through $88,500. The slide accelerated enough to spike below $87,000, but the market didn’t free-fall. Bulls defended the $85,000 zone, printing a low at $85,151. Since then, Bitcoin has been consolidating below the 23.6% Fibonacci retracement of the drop from the $93,560 swing high to the $85,151 low — a clue that the bounce is still shallow and that sellers haven’t fully backed off yet. Structurally, BTC is still on the back foot: It’s trading below $88,000, and It remains below the 100-hour Simple Moving Average, keeping short-term trend pressure pointed downward. Resistance is layered, and $89,000 is the problem area(h3) If bulls try to turn this into a recovery, they’ll have to climb through multiple ceilings in quick succession. First, BTC faces resistance around $87,150, followed by a more meaningful barrier near $87,500. From there, the market’s attention snaps back to $88,000 — the level BTC just lost and now needs to reclaim. A close back above $88,000 would improve the tone, but it doesn’t solve the bigger issue: there’s a bearish trend line on the hourly BTC/USD chart (Kraken feed) with resistance near $89,000, which also lines up with the next technical hurdle. If BTC can push through $89,000 and hold, the rebound could extend toward $90,000, with follow-through targets at $91,000 and $91,500. But until price clears that $88,000–$89,000 zone, rallies are at risk of being sold rather than chased. If BTC fails to reclaim resistance, the downside path is clear(h3) The near-term bear case is simple: if Bitcoin can’t climb back above the $87,000 area and keep traction, sellers may attempt another leg lower. Support levels line up like this: Immediate support: $85,500 First major support: $85,000 Next support: $83,500 Then $82,500 in the near term Below that, the major “don’t break this” level is still $80,000. If BTC slips under $80,000, the risk of acceleration to the downside increases significantly — not because it’s magic, but because it’s the kind of psychological and structural level that tends to trigger forced de-risking. Indicators: momentum still leans bearish(h3) The intraday indicators aren’t offering much comfort yet: Hourly MACD is losing pace in the bearish zone. Hourly RSI remains below 50, suggesting sellers still have the upper hand on short timeframes. So while the $85,000 defense held for now, the market hasn’t flipped bullish — it’s just stopped bleeding.
placeholder
December Santa Claus Rally: New highs in sight for US and European stocks?Historical data show a rising trend of US and European stocks in December. If the momentum is strong, fund managers may rush in with a buying frenzy.
Author  Mitrade
21 hours ago
Historical data show a rising trend of US and European stocks in December. If the momentum is strong, fund managers may rush in with a buying frenzy.
placeholder
XRP’s Price Action Flashes a Warning Even as ETF Flows Stay PositiveXRP’s structure remains weak despite 18 straight positive closes in spot XRP ETFs, with analysts warning that $1.98 and other nearby resistance zones could cap rebounds unless the YO region is reclaimed, while deeper downside scenarios keep $1.53 on watch as a potential (not guaranteed) accumulation area.
Author  Mitrade
17 hours ago
XRP’s structure remains weak despite 18 straight positive closes in spot XRP ETFs, with analysts warning that $1.98 and other nearby resistance zones could cap rebounds unless the YO region is reclaimed, while deeper downside scenarios keep $1.53 on watch as a potential (not guaranteed) accumulation area.
goTop
quote