

GBP/JPY eases from multi-decade highs near 200.75, but sticking close to high end
- GBP/JPY shifted back after hitting fresh 34-year highs.
- The Guppy is buried deep in bullish territory.
- JPY traders await Friday’s Japanese Tokyo CPI inflation.
GBP/JPY fell back slightly on Wednesday, easing to 200.30 through the day but sticking close to multi-decade highs near 200.75. The pair has drifted into bullish territory as markets shrug off suspected “Yenterventions” from the Bank of Japan (BoJ), which remain as-yet unconfirmed.
Despite potential direct intervention in global FX markets, the Yen continues to sag into the low end. A wide interest rate differential between the Yen and all other major global currencies is keeping JPY flows on the short side, and repeated warnings from BoJ policymakers is having a limited impact on markets that continue to sell the Yen across the board.
Japanese Tokyo Consumer Price Index (CPI) inflation due early Friday will draw attention from Yen traders. The BoJ has held interest rates at critically-low levels for years as the central bank tries to keep inflation from sinking back into stagnation levels, and this week’s Tokyo CPI inflation print will tell if the BoJ’s policies are working. At current cut, Tokyo CPI inflation for the year ended in May last printed at 1.8%. Core Tokyo CPI YoY in May is expected to rebound to 1.9% versus the previous 1.6%.
GBP/JPY technical outlook
GBP/JPY is tentatively down on Wednesday, but still remains buried deep in bull country, having closed in the green for all but four of the last 18 consecutive trading days. The pair is holding near the 200.00 major price handle, and remains up 11.5% in 2024.
The Guppy hit fresh 34-year highs of 200.75 this week, and the pair is trading steeply above the 200-day Exponential Moving Average (EMA) at 187.60.
GBP/JPY daily chart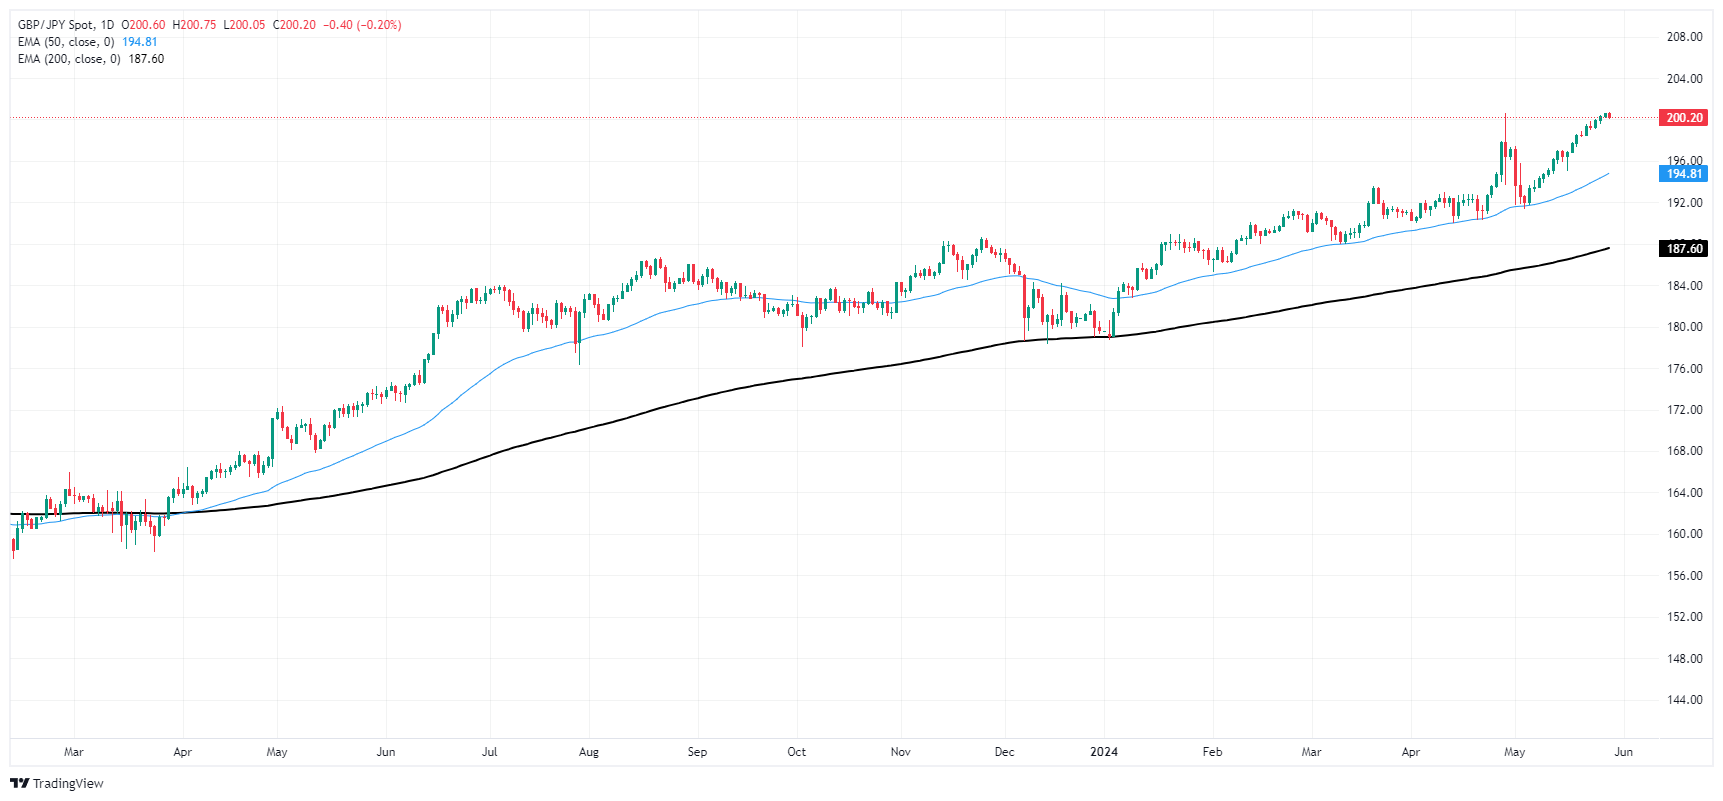
Recommended Articles


