

USD/JPY approaching 157.40 amidst broad Yen weakness
- USD/JPY climbed on Wednesday as JPY continues to sell off.
- Yen traders looking ahead to Tokyo CPI inflation on Friday.
- US GDP, PCE inflation key data this week for rate-cut hopefuls.
USD/JPY drifted into the high end on Tuesday, testing towards 157.40 as broad-market weakness in the Japanese Yen (JPY) sends Yen pairs broadly higher. Japanese Tokyo Consumer Price Index (CPI) inflation remains a key print for Yen traders this week, with US growth and inflation figures a high-impact release for investors looking for signs of rate cuts from the Federal Reserve (Fed).
Yen traders will be looking ahead to Friday’s Japanes Tokyo CPI inflation, and Core Tokyo CPI inflation is broadly expected to climb to 1.9% from 1.6%. The Bank of Japan (BoJ), concerned about a return to sub-target inflation, has steadfastly avoided raising interest rates, keeping the Yen’s rate differential with other major central banks much higher than before, sending the JPY even lower despite possible “Yenterventions” in recent weeks.
US Gross Domestic Product (GDP) and Personal Consumption Expenditure (PCE) Price Index inflation, due on Thursday and Friday, respectively, are key prints this week as investors continue to look for signs of Fed rate cuts. US Annualized Q1 GDP is expected to ease to 1.3% from the previous 1.6%, while Core PCE Price Index inflation is forecast to hold steady at 0.3% MoM.
USD/JPY technical outlook
USD/JPY continues to drift into the top end, approaching the 158.00 handle after closing in the green for all but four of the last 17 consecutive trading days. Bullish pressure is keeping the pair pinned deep in bull country, trading firmly on the north side of the 200-day Exponential Moving Average (EMA) at 148.89.
USD/JPY daily chart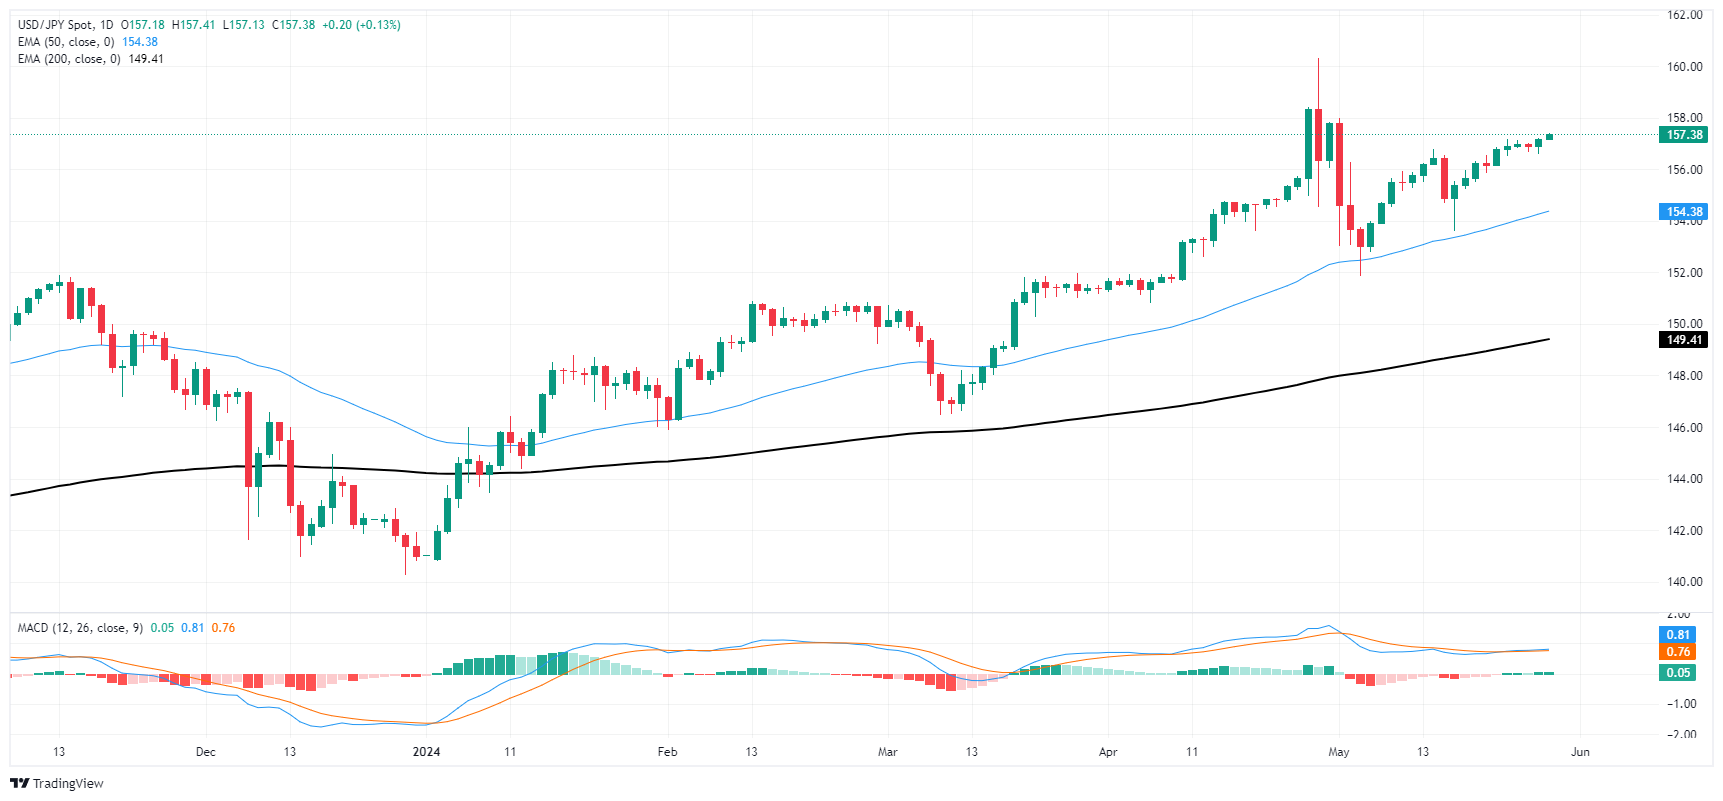
Recommended Articles


