NZD/USD rises to highs since March, market await drivers

Source Fxstreet
  • NZD/USD buyers advanced and pushed the pair to levels last seen in March at around 0.6148.
  • May’s ANZ business survey will be Tuesday’s highlight on the NZ side.
  • Across the Pacific, markets await GDP, PCE, and Fed Beige book to gather additional data on the US economic health.

The NZD/USD pair traded higher on Monday while US traders remained on the sidelines, resting on Memorial Day.

In the US scope, the Federal Reserve's (Fed) upcoming Beige Book Report could set the tone for the NZD/USD pair on Wednesday. In addition, the core Personal Consumption Expenditure (PCE) reading for April, will be highly looked upon on Friday and is expected to remain steady at 2.8% YoY. The Q1 Gross Domestic Product (GDP) revision will be released on Thursday which might also shake markets.

In addition, Fed speakers, who are scheduled throughout the week, may bring nuanced insight into the current Federal stance ahead of the media blackout period. Current market odds indicate around 50% odds of a cut in September and an 80% chance of a November rate cut. Those odds remain low for June and July

As for New Zealand, investors are banking on the May ANZ business survey due this Tuesday to shed light on areas of concern like domestic inflation and business activity.

NZD/USD technical analysis

In the daily analysis, the Relative Strength Index (RSI) shows a positive trend with the recent RSI readings hovering around the 60 to 70 territory, indicating substantial buying pressure. The slope has risen compared to previous sessions, suggesting an increase in bullish momentum. This positive tendency in the RSI coincides with rising green bars on the Moving Average Convergence Divergence (MACD), which points to a continued upward trend.

NZD/USD daily chart

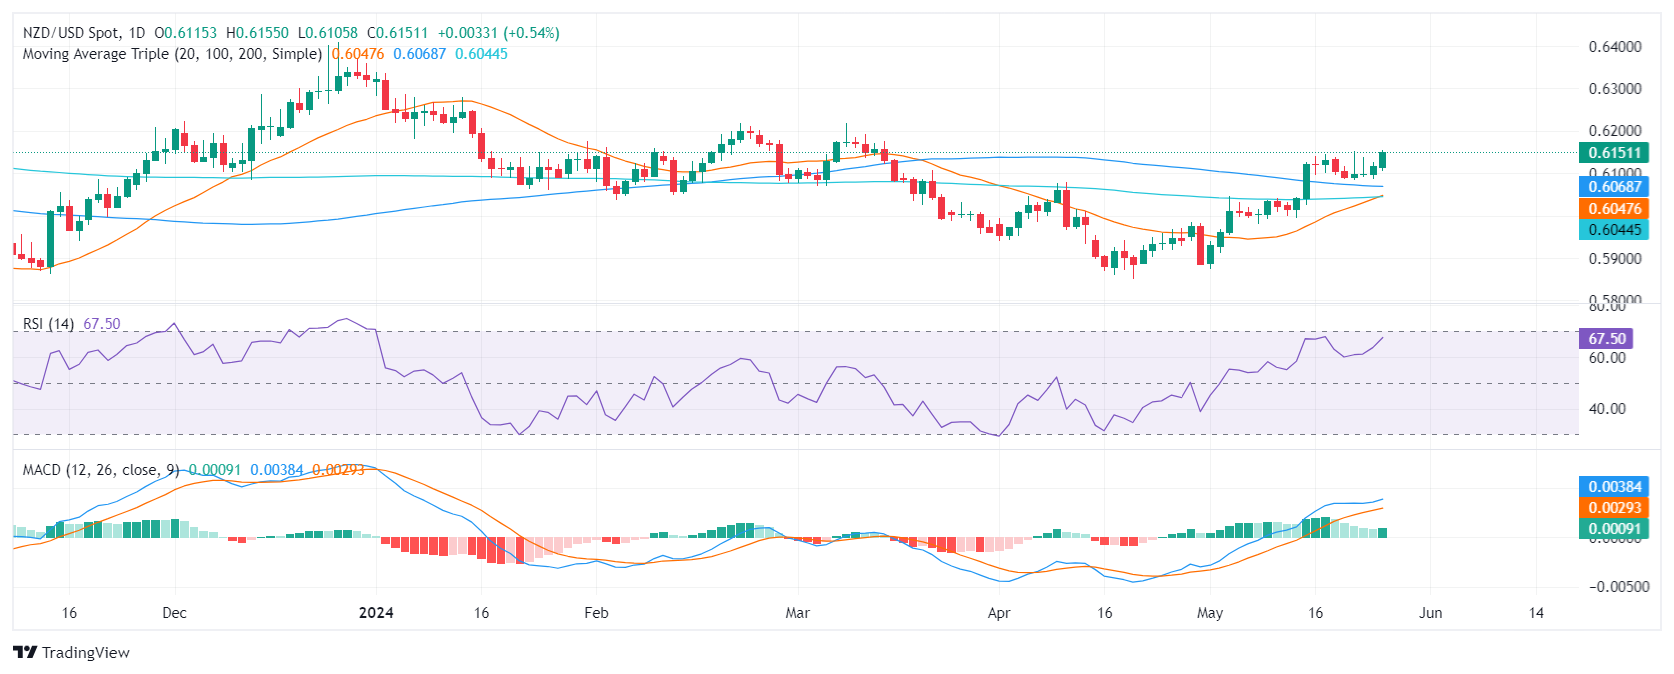
In addition, the NZD/USD pair is in a strong upward trend, trading above its 20, 100, and 200-day Simple Moving Averages (SMAs). This suggests that buyers flipped the tables and secured a bullish outlook for the long and short term.

NZD/USD

Overview
Today last price 0.6151
Today Daily Change 0.0033
Today Daily Change % 0.54
Today daily open 0.6118
 
Trends
Daily SMA20 0.6039
Daily SMA50 0.6003
Daily SMA100 0.607
Daily SMA200 0.6043
 
Levels
Previous Daily High 0.6127
Previous Daily Low 0.6087
Previous Weekly High 0.6153
Previous Weekly Low 0.6083
Previous Monthly High 0.6079
Previous Monthly Low 0.5851
Daily Fibonacci 38.2% 0.6112
Daily Fibonacci 61.8% 0.6102
Daily Pivot Point S1 0.6094
Daily Pivot Point S2 0.6071
Daily Pivot Point S3 0.6054
Daily Pivot Point R1 0.6134
Daily Pivot Point R2 0.6151
Daily Pivot Point R3 0.6174


Disclaimer: For information purposes only. Past performance is not indicative of future results.
placeholder
2025 Black Friday is coming! Which stocks may see volatility?Coming on the day right after Thanksgiving in the United States, Back Friday marks the start of the holiday shopping season. Sales data from this shopping frenzy day reflects investor confidence and consumer trends. The National Retail Federation (NRF) predicts that holiday season (Nov and Dec) retail sales in 2025 will likely exceed $1 trillion for the very first time, which represents a year-over-year increase of 3.7 to 4.2 percent. Historic data from the past decade show that the retail sector has generally outperformed the S&P 500 during the weeks before and after Black Friday. The following retailing companies are expected to be big winners:
Author  Insights
Nov 24, Mon
Coming on the day right after Thanksgiving in the United States, Back Friday marks the start of the holiday shopping season. Sales data from this shopping frenzy day reflects investor confidence and consumer trends. The National Retail Federation (NRF) predicts that holiday season (Nov and Dec) retail sales in 2025 will likely exceed $1 trillion for the very first time, which represents a year-over-year increase of 3.7 to 4.2 percent. Historic data from the past decade show that the retail sector has generally outperformed the S&P 500 during the weeks before and after Black Friday. The following retailing companies are expected to be big winners:
placeholder
Bitcoin Bleeds to $86K, But This Key Indicator Screams "The Top Isn't In"Bitcoin’s adjusted Spent Output Profit Ratio (aSOPR) has spent nearly two years coiling below the extremes seen at past bull-market peaks, even as BTC trades around $86,300 and down 9% on the week — a setup that leaves open the possibility that this cycle’s true top may still lie ahead.
Author  Mitrade
Nov 25, Tue
Bitcoin’s adjusted Spent Output Profit Ratio (aSOPR) has spent nearly two years coiling below the extremes seen at past bull-market peaks, even as BTC trades around $86,300 and down 9% on the week — a setup that leaves open the possibility that this cycle’s true top may still lie ahead.
placeholder
Bitcoin Price Rebound Gains Traction with $90K Break in SightBitcoin is trading above $87,000 and its 100-hour SMA after rebounding from $83,500, with a bearish trend line at $88,200 and resistance at $89,000–$90,000 now in focus as BTC either breaks higher toward $91,750–$94,000 or slips back toward $86,700, $85,000 and lower supports.
Author  Mitrade
Yesterday 02: 58
Bitcoin is trading above $87,000 and its 100-hour SMA after rebounding from $83,500, with a bearish trend line at $88,200 and resistance at $89,000–$90,000 now in focus as BTC either breaks higher toward $91,750–$94,000 or slips back toward $86,700, $85,000 and lower supports.
placeholder
Bitcoin Targets $89K Breakout as S&P 500 Nears ATH on Fed Rate Cut HopesBitcoin price action shows signs of a potential short squeeze as it hovers near $88,000, with analysts watching liquidity dynamics that could push it toward $89,000 or retrace to $85,000.
Author  Mitrade
9 hours ago
Bitcoin price action shows signs of a potential short squeeze as it hovers near $88,000, with analysts watching liquidity dynamics that could push it toward $89,000 or retrace to $85,000.
placeholder
Ethereum Reclaims $3K Handle—Is a Breakout Imminent?Ethereum has jumped back above $3,000 and reclaimed key Fib levels, with a bullish trend line at $2,880 and strong MACD/RSI readings putting a breakout above $3,120–$3,165 — and a possible run toward $3,320–$3,350 — on the table, as long as support around $2,980–$2,920 holds.
Author  Mitrade
9 hours ago
Ethereum has jumped back above $3,000 and reclaimed key Fib levels, with a bullish trend line at $2,880 and strong MACD/RSI readings putting a breakout above $3,120–$3,165 — and a possible run toward $3,320–$3,350 — on the table, as long as support around $2,980–$2,920 holds.
goTop
quote