USD/JPY Price Analysis: Flatlines amid subdued session, hovers around 156.90

Source Fxstreet
  • USD/JPY down slightly by 0.08% at 156.87, amid low-volume trading due to US Memorial Day.
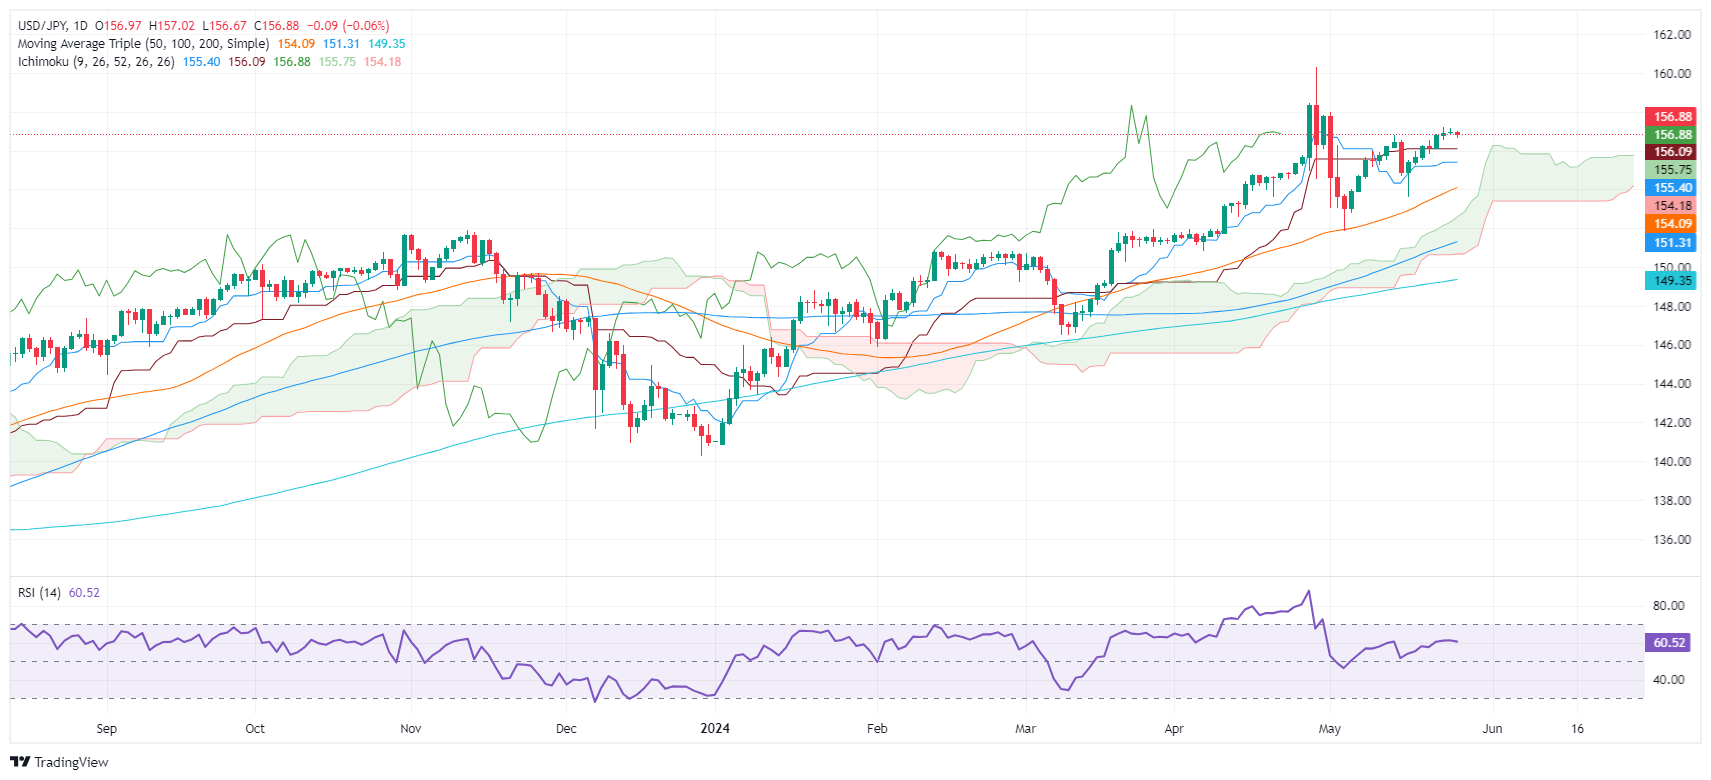
  • Technicals show an upward trend, with prices above the Ichimoku Cloud, Tenkan-Sen, and Kijun-Sen.
  • Resistance at 157.00, followed by April 26 high of 158.44 and YTD high of 160.32.
  • Support levels include Tenkan-Sen at 156.05, Senkou Span A at 155.72, Kijun-Sen at 155.39, and 50-DMA at 154.08.

The USD/JPY trade subdued amid low-volume trading on Monday. courtesy of the observance of Memorial Day, as Wall Street remained closed. The major trades at 156.87, registering modest losses of 0.08%.

USD/JPY Price Analysis: Technical outlook

From a technical perspective, the USD/JPY is upward biased, as evidenced by successive series of higher highs and lows and price action standing above the Ichimoku Cloud (Kumo). Additionally, the spot price is also above the Tenkan and Kijun-Sen, a further indication of bulls’ strength. Yet intervention threats by Japanese authorities kept buyers at bay instead of committing to open fresh long positions.

However, if USD/JPY clears the 157.00 figure, further gains lie overhead. The next resistance would be the April 26 high at 158.44, followed by the year-to-date (YTD) high at 160.32.

Conversely, if it stumbles below the confluence of the Tenkan-Sen at 156.05, that will sponsor a leg down. Next key support levels emerge at the Senkou Span A at 155.72, followed by the Kijun-Sen at 155.39, ahead of the 50-day moving average (DMA) at 154.08.

USD/JPY Price Action – Daily Chart

USD/JPY

Overview
Today last price 156.87
Today Daily Change -0.10
Today Daily Change % -0.06
Today daily open 156.97
 
Trends
Daily SMA20 155.63
Daily SMA50 153.94
Daily SMA100 151.18
Daily SMA200 149.3
 
Levels
Previous Daily High 157.15
Previous Daily Low 156.82
Previous Weekly High 157.2
Previous Weekly Low 155.5
Previous Monthly High 160.32
Previous Monthly Low 150.81
Daily Fibonacci 38.2% 157.02
Daily Fibonacci 61.8% 156.95
Daily Pivot Point S1 156.81
Daily Pivot Point S2 156.65
Daily Pivot Point S3 156.49
Daily Pivot Point R1 157.14
Daily Pivot Point R2 157.3
Daily Pivot Point R3 157.46


Disclaimer: For information purposes only. Past performance is not indicative of future results.
placeholder
Is SaaS Dead? The Truth Behind the Software Meltdown, the Missing Floor, and the Peak That’s Not Coming BackOver the past few weeks, you’ve probably seen the same refrain everywhere: “SaaS has crashed this much, valuations must have bottomed, time to buy the dip.”On the surface, that sounds tempting. A lot
Author  TradingKey
13 hours ago
Over the past few weeks, you’ve probably seen the same refrain everywhere: “SaaS has crashed this much, valuations must have bottomed, time to buy the dip.”On the surface, that sounds tempting. A lot
placeholder
Bitcoin Realized Losses Rival Luna Crash Levels as Market Absorbs $2 Billion HitBitcoin network realizes $1.99 billion in losses, rivaling the 2022 Luna crash, though analysts view the $67,000 flush as a cyclical cleanse rather than a structural breakdown.
Author  Mitrade
16 hours ago
Bitcoin network realizes $1.99 billion in losses, rivaling the 2022 Luna crash, though analysts view the $67,000 flush as a cyclical cleanse rather than a structural breakdown.
placeholder
Financial Markets 2026: Volatility Catalysts in Gold, Silver, Oil, and Blue-Chip Stocks—A CFD Trader's OutlookThe financial world is perpetually in motion, but the landscape for 2026 seems to be shaping up to be particularly dynamic. For CFD traders navigating global markets, this heightened volatility could present a distinctive set of challenges and opportunities.
Author  Rachel Weiss
18 hours ago
The financial world is perpetually in motion, but the landscape for 2026 seems to be shaping up to be particularly dynamic. For CFD traders navigating global markets, this heightened volatility could present a distinctive set of challenges and opportunities.
placeholder
AUD/USD lurches into highs after NFP beats expectationsThe Australian Dollar surged to its highest level since August 2022 on Wednesday after the delayed US Non-Farm Payrolls (NFP) report came in stronger than expected at 130K, well above the 70K consensus, though massive downward revisions to 2025 payroll data (898K lower for March 2025 alone) painted
Author  FXStreet
22 hours ago
The Australian Dollar surged to its highest level since August 2022 on Wednesday after the delayed US Non-Farm Payrolls (NFP) report came in stronger than expected at 130K, well above the 70K consensus, though massive downward revisions to 2025 payroll data (898K lower for March 2025 alone) painted
placeholder
Should You Buy Bitcoin Now or Buy Tesla Which Holds Bitcoin? In 2026, Bitcoin (BTC) suffered a Waterloo-style sell-off, with prices quickly retreating to around $60,000 from a period high of nearly $98,000 at the start of the year. Bitcoin is once
Author  TradingKey
Yesterday 10: 14
In 2026, Bitcoin (BTC) suffered a Waterloo-style sell-off, with prices quickly retreating to around $60,000 from a period high of nearly $98,000 at the start of the year. Bitcoin is once
Related Instrument
goTop
quote