GBP/JPY Price Analysis: Bulls keep momentum steady, overbought indicators signal near-term correction possible

Source Fxstreet
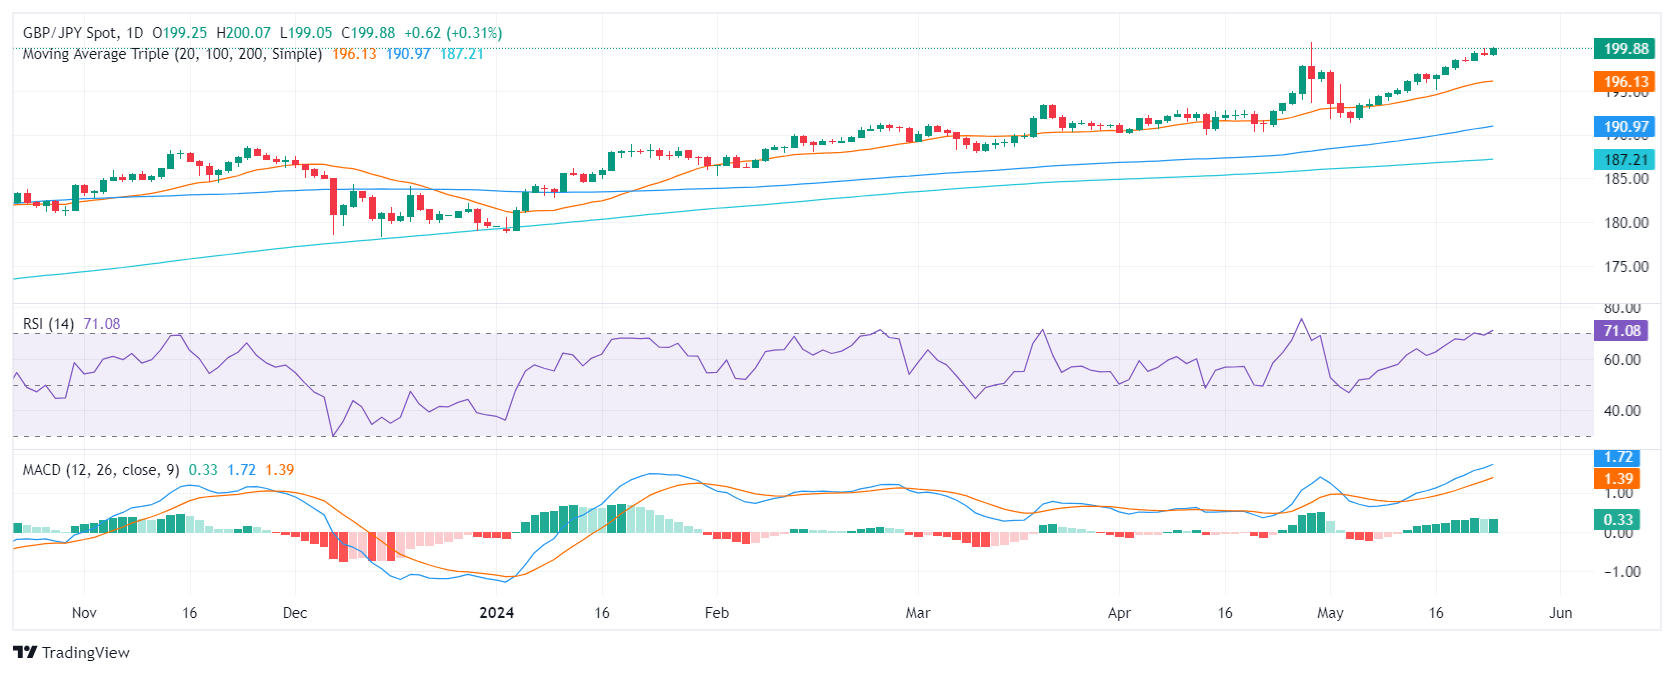
  • The pair rose to highs since 2007 at 199.90.
  • The daily RSI indicates an overextended buying momentum, suggesting a pending technical correction.
  • The hourly indicators have already started to consolidate.

In Friday’s session, the GBP/JPY pair experienced upward momentum, rising by 0.37% and the pair reached multi-year highs, a clear indication of the stronghold buyers have within the market. While a near-term technical correction could potentially occur due to the overbought condition, the overall outlook remains bullish for the cross.

In the daily chart, the Relative Strength Index (RSI) has moved deep into overbought territory. The persistently high values hint at strong buying sentiment, but they also suggest a potential future correction. The Moving Average Convergence Divergence (MACD) reveals flat green bars, indicating positive momentum despite the relatively stable trend which may suggest that the pair might consolidate for the rest of the session.

GBP/JPY daily chart
When examining the hourly chart, the RSI reveals noticeable ebbs and flows, with the latest value standing at 61. Although still positive, this level appears somewhat less intense when compared to the daily chart. The hourly MACD histogram continues to display flat green bars, indicating steady positive momentum which mirrors its daily counterpart.

GBP/JPY hourly chart
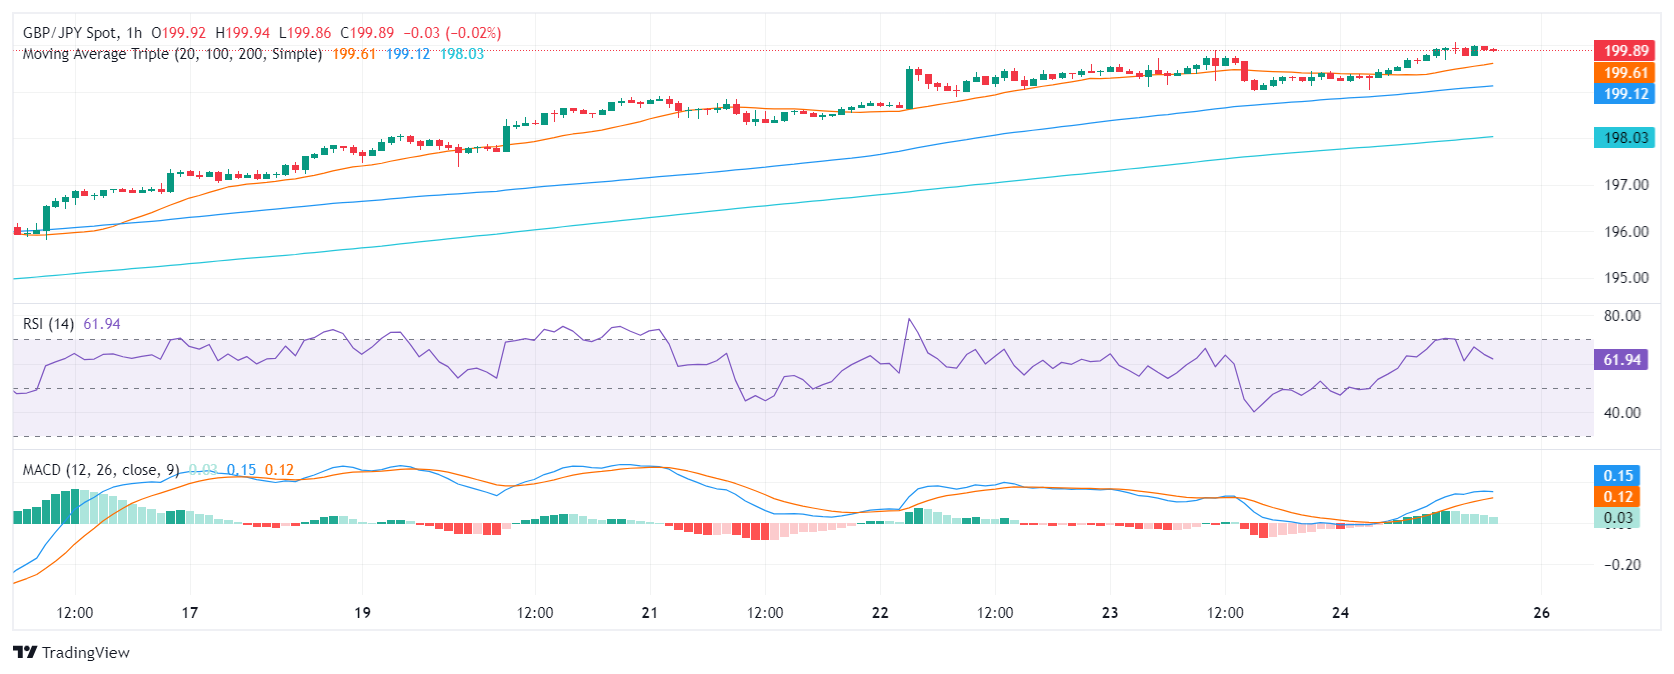
From a broader outlook, the GBP/JPY's position relative to its Simple Moving Averages (SMAs) helps to clarify the overall trend. The pair stands above the 20, 100, and 200-day SMAs, reflecting a bullish outlook for both short and long-term scenarios.


GBP/JPY

Overview
Today last price 199.87
Today Daily Change 0.61
Today Daily Change % 0.31
Today daily open 199.26
 
Trends
Daily SMA20 196.03
Daily SMA50 193.45
Daily SMA100 190.81
Daily SMA200 187.14
 
Levels
Previous Daily High 199.9
Previous Daily Low 199.02
Previous Weekly High 197.86
Previous Weekly Low 194.74
Previous Monthly High 200.59
Previous Monthly Low 190
Daily Fibonacci 38.2% 199.36
Daily Fibonacci 61.8% 199.56
Daily Pivot Point S1 198.89
Daily Pivot Point S2 198.51
Daily Pivot Point S3 198.01
Daily Pivot Point R1 199.77
Daily Pivot Point R2 200.27
Daily Pivot Point R3 200.64


Disclaimer: For information purposes only. Past performance is not indicative of future results.
placeholder
The Dollar Is Back — And Bitcoin May Be in TroubleAfter nearly three months of range-bound trading, the US Dollar Index has broken above the 100 mark, its highest level since August, reigniting concerns across risk asset markets.
Author  Beincrypto
7 hours ago
After nearly three months of range-bound trading, the US Dollar Index has broken above the 100 mark, its highest level since August, reigniting concerns across risk asset markets.
placeholder
Goldman Sachs and Morgan Stanley warn of potential 20% market declineGoldman Sachs and Morgan Stanley CEOs predict a 10-20% market pullback within the next 12-24 months.
Author  Cryptopolitan
7 hours ago
Goldman Sachs and Morgan Stanley CEOs predict a 10-20% market pullback within the next 12-24 months.
placeholder
USD/CAD Price Forecast: Tests seven-month highs near 1.4100USD/CAD extends its gains for the fourth successive session, trading around 1.4060 during the European hours on Tuesday.
Author  FXStreet
7 hours ago
USD/CAD extends its gains for the fourth successive session, trading around 1.4060 during the European hours on Tuesday.
placeholder
XRP, BNB, and SOL record major losses as Bitcoin slides to $105,000Ripple (XRP), BNB, and Solana (SOL) are trading in the red on Tuesday as the broader cryptocurrency market suffers a sell-off wave that has triggered $1 billion in liquidations over the last 24 hours.
Author  FXStreet
10 hours ago
Ripple (XRP), BNB, and Solana (SOL) are trading in the red on Tuesday as the broader cryptocurrency market suffers a sell-off wave that has triggered $1 billion in liquidations over the last 24 hours.
placeholder
US Dollar Index rises to near 100.00 due to cautious Fed policy outlookThe US Dollar Index (DXY) is extending its winning streak for the fifth consecutive session and trading around 99.90 during the Asian hours on Tuesday.
Author  FXStreet
11 hours ago
The US Dollar Index (DXY) is extending its winning streak for the fifth consecutive session and trading around 99.90 during the Asian hours on Tuesday.
Related Instrument
goTop
quote