EUR/JPY Price Analysis: Surges toward 160.00 on risk-on mood

Source Fxstreet
  • EUR/JPY's significant rally driven by a neutral to upward trend, with buyers targeting the 160.00 mark.
  • Resistance at top of Ichimoku Cloud (161.26) and 162.00 level in sight for continued bullish movement.
  • Downside risks include potential supports at 159.32 (Kumo bottom), 158.73, and 157.51 (Tenkan-Sen).

The Euro (EUR) rallied sharply against the Japanese Yen (JPY) on Wednesday, posting gains of 1.27% or more than 200 pips as the EUR/JPY traded at 159.92, at the brisk of conquering 160.00.

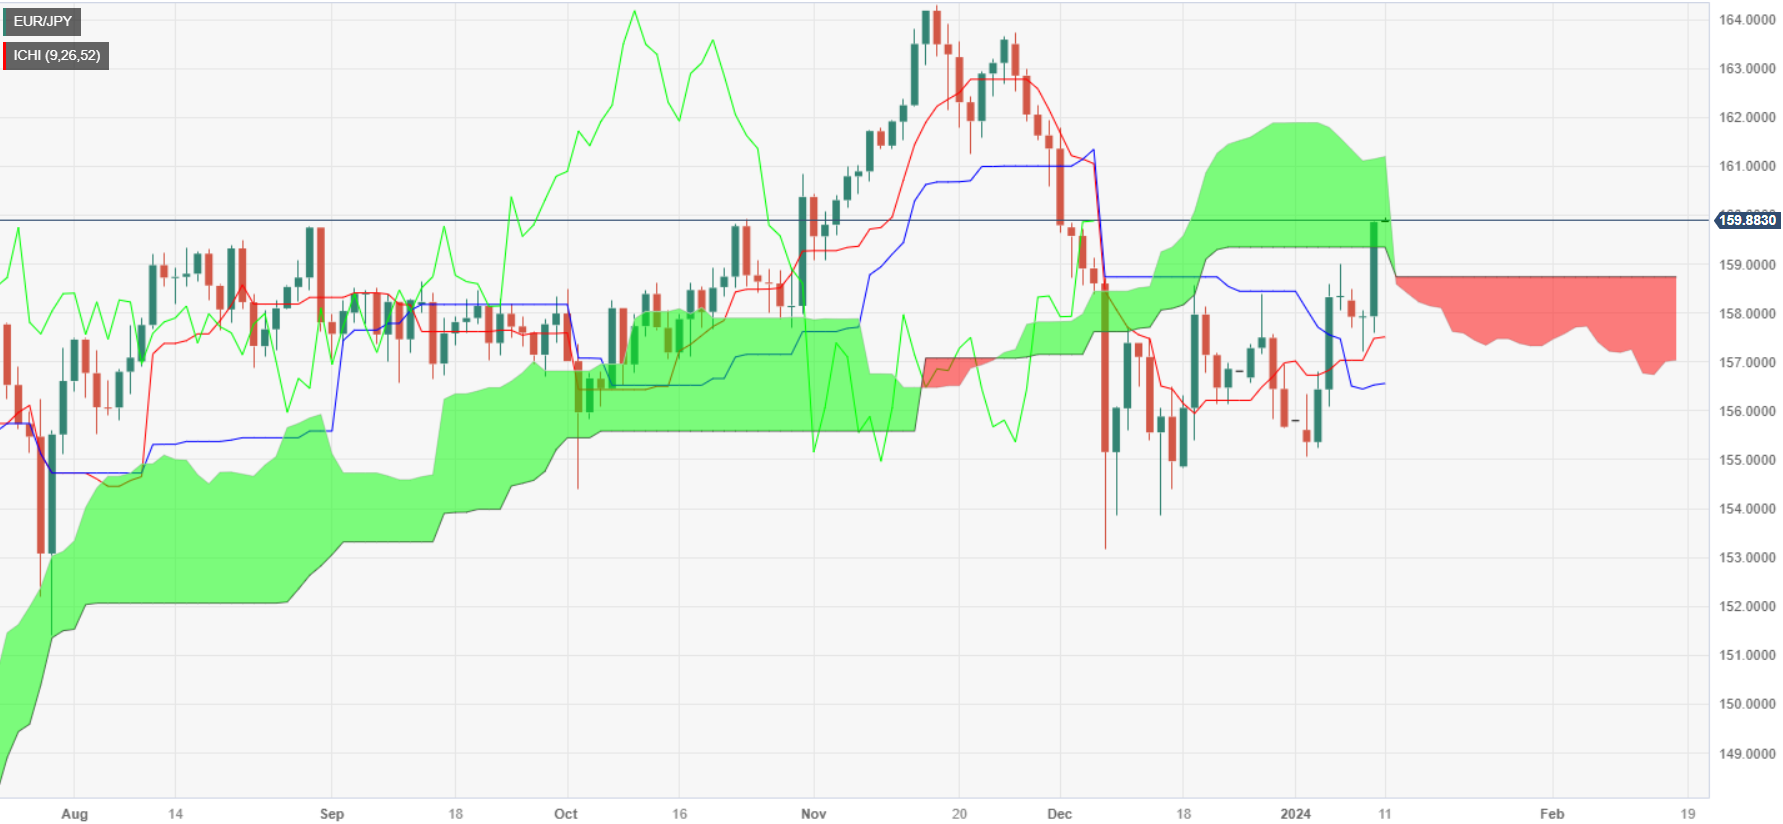
The EUR/JPY daily chart suggests the pair is neutral to upward biased after buyers pushed the pair inside the Ichimoku Cloud (Kumo). if they would like to resume the uptrend, they must reclaim the 160.00 figure, followed by the top of the Kumo at 161.26. on further upside strength, the next resistance would be 162.00.

On the other hand, if sellers would like prices to edge lower, they must cap EUR/JPY’s uptrend at 162.00. That might open the door for further losses, exposing the bottom of the Kumo at 159.32. Further downside is seen at the Senkou Span B at 158.73, followed by the Tenkan-Sen at 157.51, before diving toward the Senkou Span A at 157.02.

EUR/JPY Price Action – Daily Chart

EUR/JPY Key Technical Levels


Disclaimer: For information purposes only. Past performance is not indicative of future results.
placeholder
A Crash After a Surge: Why Silver Lost 40% in a Week?TradingKey - Spot Silver ( XAGUSD) prices have continued to decline; on Thursday, silver plummeted as much as 20% to break below $71 per ounce, and on Friday the sell-off intensified as prices fell fu
Author  TradingKey
Feb 06, Fri
TradingKey - Spot Silver ( XAGUSD) prices have continued to decline; on Thursday, silver plummeted as much as 20% to break below $71 per ounce, and on Friday the sell-off intensified as prices fell fu
placeholder
Bitcoin is trading around $63,000, down nearly 40% from its peak near $126,000Wall Street desks are no longer talking about upside dreams. The talk right now is how far Bitcoin charts could fall if selling keeps piling up. According to data from TradingView, Bitcoin’s price now sits at a shocking $63,500, after falling from $70,000 just this morning, losing $13,000 in 6 days, and staying far below […]
Author  Cryptopolitan
Feb 06, Fri
Wall Street desks are no longer talking about upside dreams. The talk right now is how far Bitcoin charts could fall if selling keeps piling up. According to data from TradingView, Bitcoin’s price now sits at a shocking $63,500, after falling from $70,000 just this morning, losing $13,000 in 6 days, and staying far below […]
placeholder
WTI declines below $63.00 as US-Iran talks loom West Texas Intermediate (WTI), the US crude oil benchmark, is trading around $62.85 during the Asian trading hours on Friday. The WTI price declines after the United States (US) and Iran agreed to hold talks in Oman on Friday. 
Author  FXStreet
Feb 06, Fri
West Texas Intermediate (WTI), the US crude oil benchmark, is trading around $62.85 during the Asian trading hours on Friday. The WTI price declines after the United States (US) and Iran agreed to hold talks in Oman on Friday. 
placeholder
Bitcoin Surrenders $65,000 as Analysts Warn of ‘Structural’ Market BreakBitcoin plunges 11% to break $65k as analysts term the crash "structural," citing a $1 trillion market wipeout and $2.09 billion in daily liquidations.
Author  Mitrade
Feb 06, Fri
Bitcoin plunges 11% to break $65k as analysts term the crash "structural," citing a $1 trillion market wipeout and $2.09 billion in daily liquidations.
placeholder
Bitcoin Drops to $70,000. U.S. Government Refuses to Bail Out Market, End of Bull Market or Golden Pit? The U.S. government refuses to bail out Bitcoin, and with Fed rate cuts nowhere in sight, a continued downward trend to test for a bottom is likely after a brief rebound.During the mid-da
Author  TradingKey
Feb 05, Thu
The U.S. government refuses to bail out Bitcoin, and with Fed rate cuts nowhere in sight, a continued downward trend to test for a bottom is likely after a brief rebound.During the mid-da
Related Instrument
goTop
quote