NZD/USD Price Analysis: Bullish sentiment maintains despite softening momentum

Source Fxstreet
  • Despite softening positive momentum indicated by the daily MACD, the overall trend still favors the buyers.
  • Hourly chart shows fairly neutral RSI but negative momentum in MACD, signaling possible short-term fluctuations.
  • Regardless of potential shifts suggested by hourly indicators, the overall bullish bias based on daily SMAs is intact.
  • Signs of weakening buying momentum in NZD/USD implies potential retests of key SMAs, dictating investor alertness.

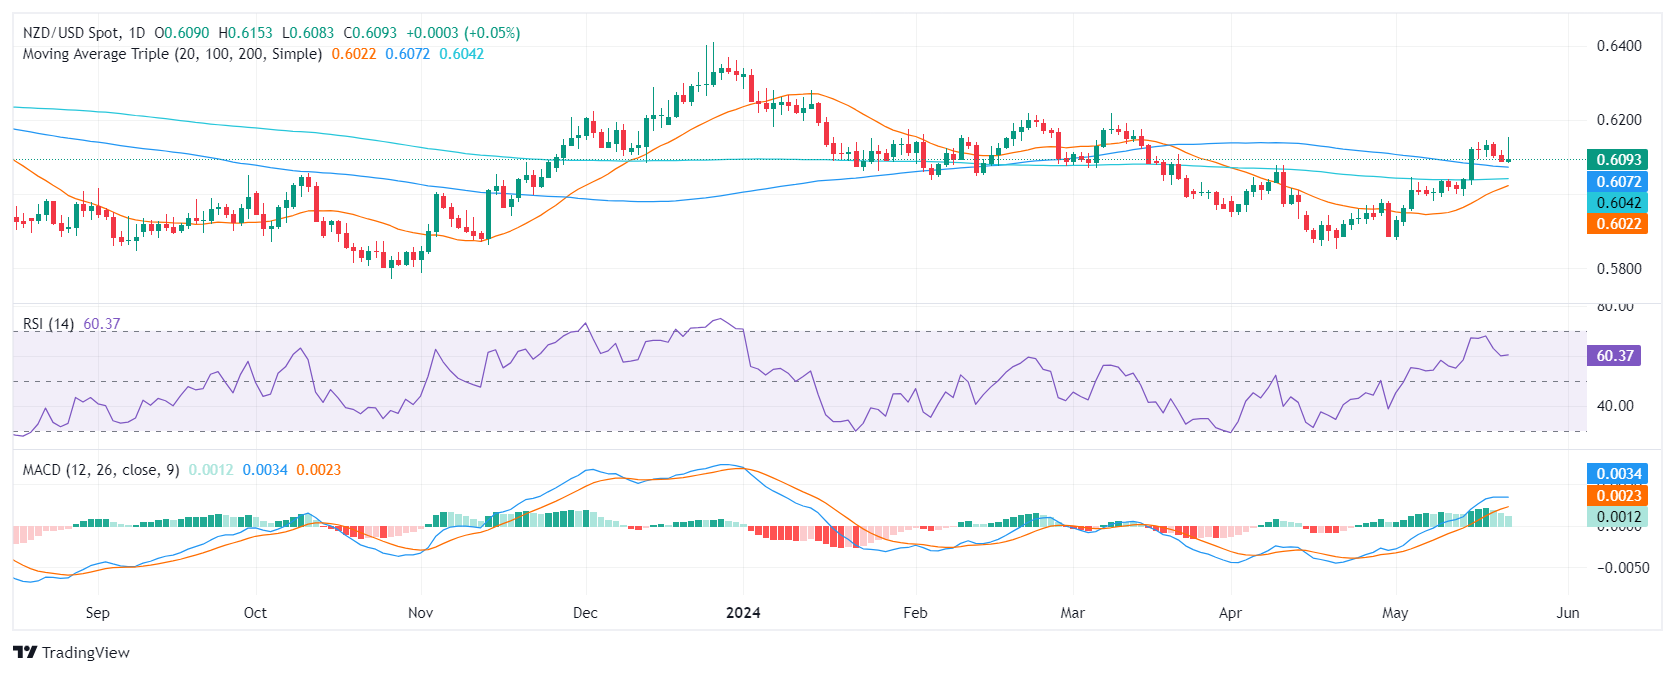
On Wednesday's session, the NZD/USD showed diminishing buying traction and fell just below 0.6100. However, the short-term outlook will be positive if the pair maintains its position over new reference points set by 100 and 200-day Simple Moving Averages (SMAs). If lost, the bears might step in aggressively.

Examining the daily chart, the Relative Strength Index (RSI) exhibits a positive but flattening trend, with its most recent reading of 60. Simultaneously, the Moving Average Convergence Divergence (MACD) displays decreasing green bars indicating a slight softening of positive momentum.

NZD/USD daily chart
Focusing on the hourly view, the RSI has moderately adjusted with the latest reading of 41, reflecting a fairly neutral direction. Notably, the MACD histogram has produced consistently flat red bars, signaling negative momentum on an intraday basis.

NZD/USD hourly chart
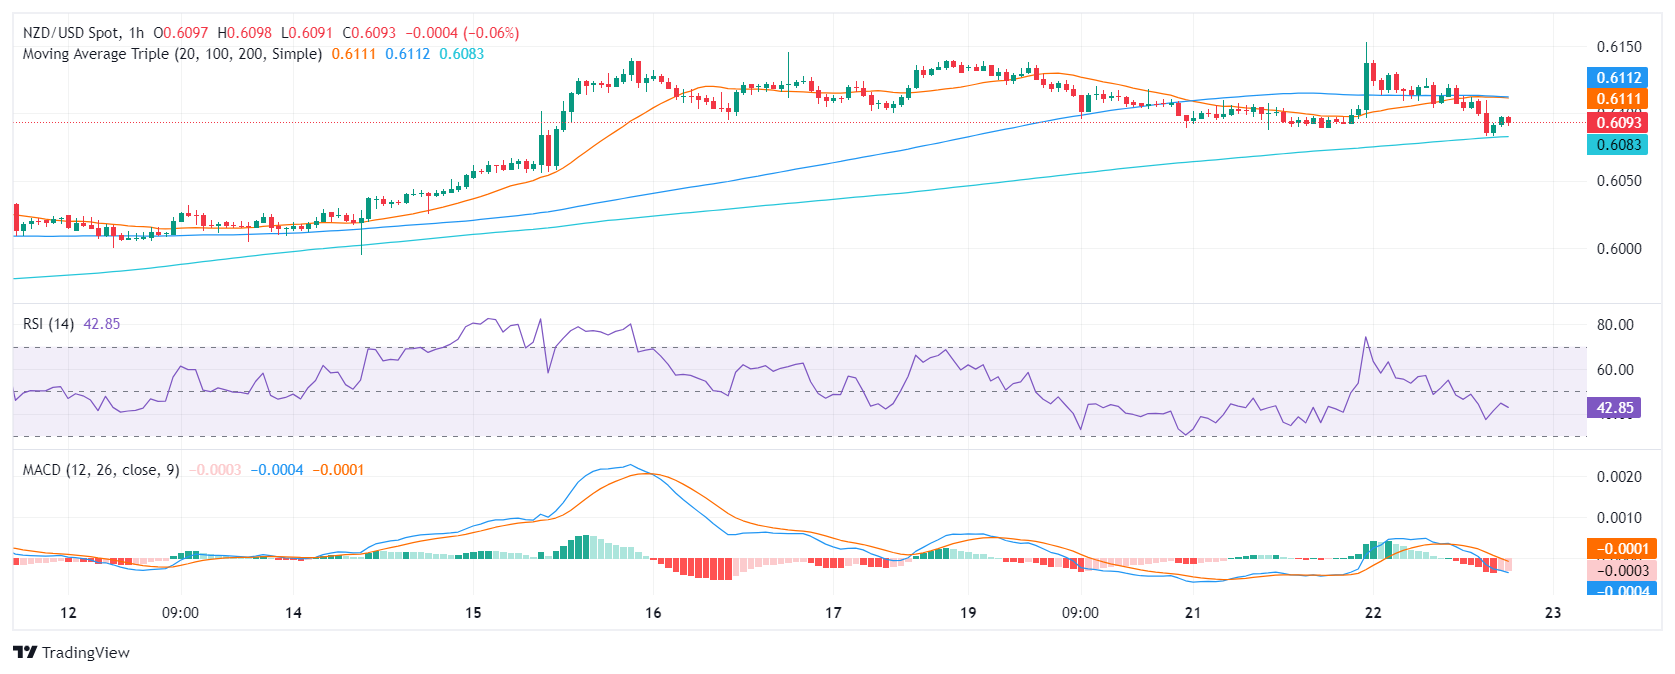
In conclusion, investors seem to be taking profits and, should the pair hold above the recently-conquered 100 and 200-day Simple Moving Averages (SMAs), any downward movement should not necessarily be considered a selling signal. However, buying traction appears to be waning, and the pair is set for a retest of the mentioned SMAs.


NZD/USD

Overview
Today last price 0.6093
Today Daily Change 0.0003
Today Daily Change % 0.05
Today daily open 0.609
 
Trends
Daily SMA20 0.6014
Daily SMA50 0.6004
Daily SMA100 0.6074
Daily SMA200 0.6041
 
Levels
Previous Daily High 0.6118
Previous Daily Low 0.6087
Previous Weekly High 0.6146
Previous Weekly Low 0.5995
Previous Monthly High 0.6079
Previous Monthly Low 0.5851
Daily Fibonacci 38.2% 0.6099
Daily Fibonacci 61.8% 0.6106
Daily Pivot Point S1 0.6079
Daily Pivot Point S2 0.6068
Daily Pivot Point S3 0.6049
Daily Pivot Point R1 0.6109
Daily Pivot Point R2 0.6129
Daily Pivot Point R3 0.614


Disclaimer: For information purposes only. Past performance is not indicative of future results.
placeholder
Gold Price Forecast: XAU/USD declines below $4,050 on USD strength and hawkish Fed comments Gold price (XAU/USD) extends the decline to around $4,030 during the early Asian session on Tuesday. The precious metal edges lower as traders dialed back expectations of a US interest rate cut next month.
Author  FXStreet
Nov 18, Tue
Gold price (XAU/USD) extends the decline to around $4,030 during the early Asian session on Tuesday. The precious metal edges lower as traders dialed back expectations of a US interest rate cut next month.
placeholder
Top 3 Price Prediction: Bitcoin, Ethereum, Ripple – BTC, ETH and XRP Look for a Foothold After a Sharp ShakeoutBitcoin trades near $92,600 after a dip below $90,000, while Ethereum around $3,118 and XRP near $2.21–$2.23 sit on key support zones, as BTC, ETH and XRP all try to turn a sharp correction into a tradable rebound rather than a deeper slide.
Author  Mitrade
Nov 19, Wed
Bitcoin trades near $92,600 after a dip below $90,000, while Ethereum around $3,118 and XRP near $2.21–$2.23 sit on key support zones, as BTC, ETH and XRP all try to turn a sharp correction into a tradable rebound rather than a deeper slide.
placeholder
Could XRP Really Catch Ethereum? Analysts Revisit the Question as ETF Tailwinds BuildAs US spot XRP ETFs roll out and issuers like Canary Capital and Franklin Templeton step in, analysts say XRP’s market cap could climb on growing utility and ETF accumulation—but overtaking Ethereum’s $373 billion smart-contract powerhouse remains a long-shot, at least for now.
Author  Mitrade
Nov 20, Thu
As US spot XRP ETFs roll out and issuers like Canary Capital and Franklin Templeton step in, analysts say XRP’s market cap could climb on growing utility and ETF accumulation—but overtaking Ethereum’s $373 billion smart-contract powerhouse remains a long-shot, at least for now.
placeholder
Bitcoin's Drop to $86K Approaches 'Max Pain' Zone, Yet Presents Potential Buying OpportunityAnalysts identify the $84,000 to $73,000 range as Bitcoin's likely "max pain" territory where capitulation may occur.
Author  Mitrade
Yesterday 03: 35
Analysts identify the $84,000 to $73,000 range as Bitcoin's likely "max pain" territory where capitulation may occur.
placeholder
Market Meltdown: BTC, ETH, and XRP Capitulate as Bears Seize ControlBitcoin trades around $85,900 after breaking below $86,000, with Ethereum under $2,791 and XRP below $1.99 as BTC, ETH and XRP extend weekly losses of 8–10%, forcing traders to focus on supports at $85,000, $2,749 and $1.77 for clues on whether this sell-off has further to run.
Author  Mitrade
Yesterday 04: 15
Bitcoin trades around $85,900 after breaking below $86,000, with Ethereum under $2,791 and XRP below $1.99 as BTC, ETH and XRP extend weekly losses of 8–10%, forcing traders to focus on supports at $85,000, $2,749 and $1.77 for clues on whether this sell-off has further to run.
goTop
quote