AUD/USD Price Analysis: Posts fresh five-day low near 0.6640

Source Fxstreet
  • AUD/USD refreshes five-day low near 0.6640 amid cautious market mood.
  • Investors await the FOMC minutes to project the next move in the US Dollar.
  • US bond yields rise amid uncertainty over Fed rate cuts in September.

The AUD/USD pair slumps to 0.6640 as the US Dollar exhibits firm footing in Wednesday’s New York session ahead of the release of the Federal Open Market Committee (FOMC) minutes of May’s policy meeting, which will be published later in the day.

Fed officials’ views on the interest rate outlook are expected to have remained hawkish as United States consume price inflation remained stubbornly higher in the first three months of this year. The impact of the Fed’s minutes could be light on the US Dollar as April’s inflation declined, expectedly released after May’s meeting, which has indicated that the progress in the disinflationary process was temporarily stalled.

The US Dollar Index (DXY), which tracks the Greenback’s value against six major currencies, advances to 104.80. More upside in the US Dollar looks likely as speculation for the Fed pivoting interest rate cuts has slightly eased.

The Australian Dollar fails to achieve a firm-footing despite the People’s Bank of China (PBoC) continued with expansionary policy stance to uplift China’s economic prospects. It is worth noting that Australia is the leading trading partner of China and historically higher monetary stimulus by world’s second largest economy improves the outlook of the Australian Dollar.

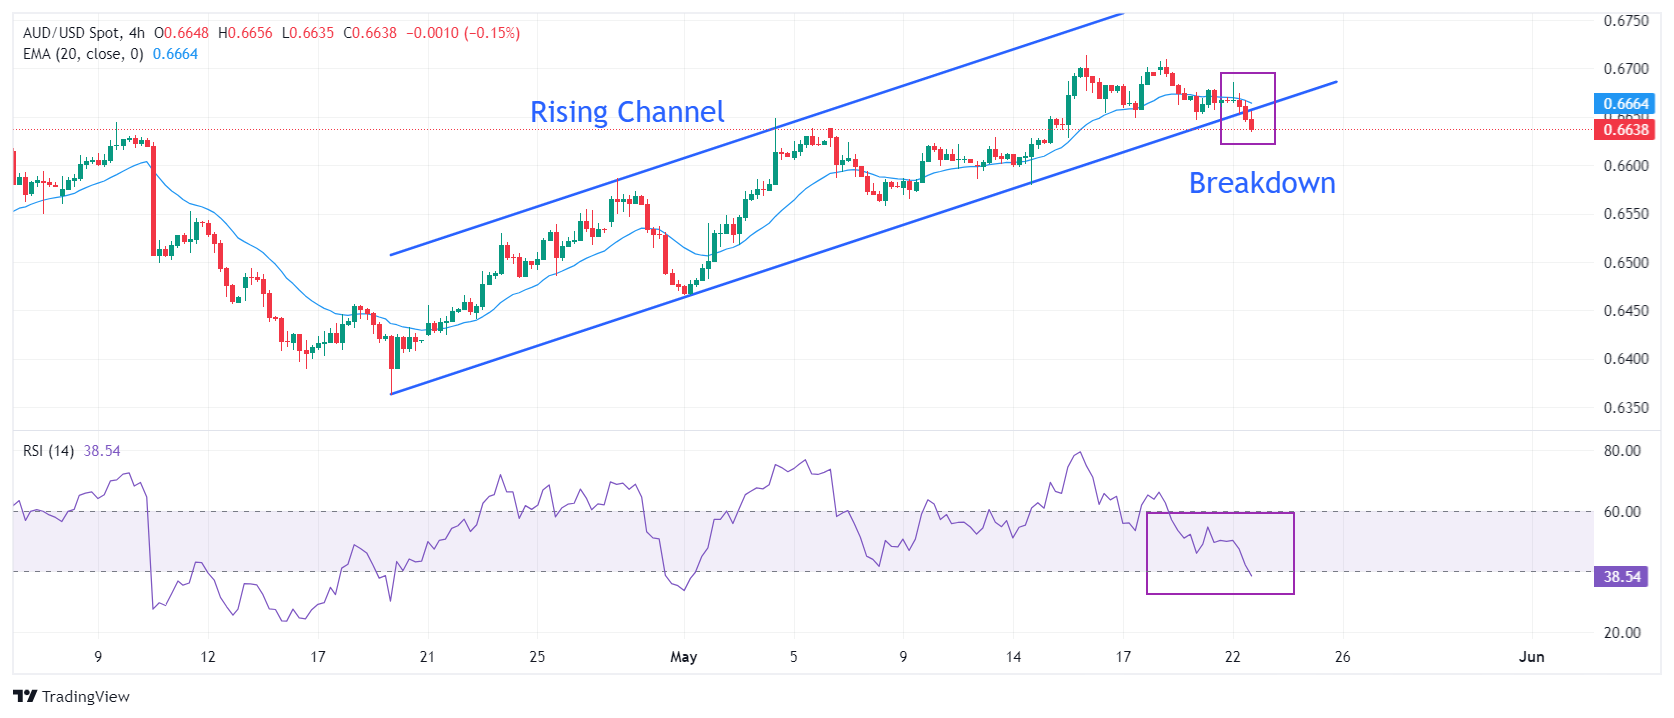
AUD/USD delivers a breakdown of the Rising Channel chart pattern formed on a four-hour timeframe. A breakdown of the above-mentioned pattern suggests an establishment of a bearish reversal. The near-term outlook of the Aussie asset is uncertain as it has stabilized below the 20-period Exponential Moving Average (EMA), which trades around 0.6666.

The 14-period Relative Strength Index (RSI) slips below 40.00. Sustainability below 40.00 will shift momentum towards the downside.

More downside below May 15 at 0.6622 will expose the asset to May 14 low at 0.6580, followed by May 1 high at 0.6540.

On the flip side, a decisive move above May’s high at 0.6714 will drive the asset towards January 3 high at 0.6771 and the round-level resistance of 0.6800

AUD/USD four-hour chart

AUD/USD

Overview
Today last price 0.6638
Today Daily Change -0.0027
Today Daily Change % -0.41
Today daily open 0.6665
 
Trends
Daily SMA20 0.6597
Daily SMA50 0.6553
Daily SMA100 0.6565
Daily SMA200 0.6527
 
Levels
Previous Daily High 0.6679
Previous Daily Low 0.6646
Previous Weekly High 0.6714
Previous Weekly Low 0.658
Previous Monthly High 0.6644
Previous Monthly Low 0.6362
Daily Fibonacci 38.2% 0.6659
Daily Fibonacci 61.8% 0.6667
Daily Pivot Point S1 0.6648
Daily Pivot Point S2 0.6631
Daily Pivot Point S3 0.6616
Daily Pivot Point R1 0.6681
Daily Pivot Point R2 0.6696
Daily Pivot Point R3 0.6713


Disclaimer: For information purposes only. Past performance is not indicative of future results.
placeholder
Why a Quiet 2025 Signals a Massive 2026 Crypto Bull Run: Bitwise CIO ExplainsBitwise's Matt Hougan Predicts a Crypto Boom in 2026 Amid Current Market Struggles
Author  Mitrade
Nov 13, Thu
Bitwise's Matt Hougan Predicts a Crypto Boom in 2026 Amid Current Market Struggles
placeholder
Bitcoin vs. Ethereum: Distinct Monetary UniversesBitcoin and Ethereum are diverging significantly in their monetary roles, according to a joint report from Glassnode and Keyrock.
Author  Mitrade
Yesterday 03: 01
Bitcoin and Ethereum are diverging significantly in their monetary roles, according to a joint report from Glassnode and Keyrock.
placeholder
Ethereum slides 5% as bears lean on $3,500 cap and put $3,150 support in focusEthereum (ETH) drops more than 5% after a failed push above $3,550, with price sliding to $3,153 and now holding below $3,350, the 100-hour SMA and a bearish trend line at $3,500; unless bulls reclaim the $3,350–$3,500 zone, the short-term bias stays bearish and a clean break under $3,150 could expose $3,050, $3,000 and even the $2,880–$2,850 support area.
Author  Mitrade
Yesterday 03: 41
Ethereum (ETH) drops more than 5% after a failed push above $3,550, with price sliding to $3,153 and now holding below $3,350, the 100-hour SMA and a bearish trend line at $3,500; unless bulls reclaim the $3,350–$3,500 zone, the short-term bias stays bearish and a clean break under $3,150 could expose $3,050, $3,000 and even the $2,880–$2,850 support area.
placeholder
Gold Posts Biggest Weekly Gain in a Month as US Data Delays Fuel UncertaintyGold climbed higher on Friday, marking its strongest weekly performance in a month, as traders weighed the impact of a data backlog following the end of the US government's extended shutdown. Silver also moved upward.
Author  Mitrade
Yesterday 05: 48
Gold climbed higher on Friday, marking its strongest weekly performance in a month, as traders weighed the impact of a data backlog following the end of the US government's extended shutdown. Silver also moved upward.
placeholder
Top 3 Price Prediction: Bitcoin, Ethereum, Ripple – BTC, ETH, and XRP flash deeper downside risks as market selloff intensifiesBitcoin (BTC), Ethereum (ETH) and Ripple (XRP) trade in red on Friday after correcting more than 5%, 10% and 2%, respectively, so far this week.
Author  FXStreet
23 hours ago
Bitcoin (BTC), Ethereum (ETH) and Ripple (XRP) trade in red on Friday after correcting more than 5%, 10% and 2%, respectively, so far this week.
Related Instrument
goTop
quote