AUD/USD slips below 0.6700 amid hawkish Fed stance despite RBA’s minutes

Source Fxstreet
  • AUD/USD remains virtually unchanged at 0.6668, following a 0.03% loss against the US Dollar.
  • Fed officials Bostic, Waller, and Barr highlight the priority of achieving a 2% inflation goal, delaying rate cut hints.
  • RBA meeting minutes reveal hawkish considerations, though ANZ economists predict a modest easing cycle with three rate cuts.

The Australian Dollar registered losses of 0.03% against the US Dollar as Federal Reserve officials hitting the wires were reluctant to hint at when rate cuts begin. Consequently, US Treasury bond yields fell, while the Greenback stood tall, flat at around 104.62. The AUD/USD trades at 0.6668, virtually unchanged as Wednesday’s Asian session begins.

AUD/USD falls despite hawkish RBA’s minutes, offset by Fed officials' focus on inflation

Wall Street finished the session with gains ahead of the release of NVIDIA’s earnings. Fed officials led by Atlanta’s Fed President Bostic and Governors Waller and Barr crossed the newswires.

Bostic stated he isn’t in a hurry to lower rates and emphasized the Fed’s job to achieve the 2% goal, saying that it’s the bank’s priority. Lately, Fed Governor Waller stated that despite seeing progress on inflation after April’s inflation data, he needs to see subsequent months of inflation trending lower. Lastly, Vice-Chair Barr remarked, "We still need to finish the job on inflation."

Even though Fed commentary was slightly “hawkish,” US Treasury yields dropped, but the US Dollar remained steady. That said, North American traders brace for the release of the Federal Open Market Committee (FOMC) minutes on Wednesday.

On the Australian side, the minutes of the Reserve Bank of Australia’s (RBA) last meeting were tilted hawkish as RBA board members considered a rate hike during their discussions. ANZ economists , in a note, wrote,“We continue to think that the economy is softening enough to deliver in target inflation and hence retain our view that the next move in the cash rate is down.” They estimate a modest easing cycle with just three rate cuts.

The US economic docket for the week before the latest Fed meeting minutes was released on Wednesday. On Thursday, US Initial Jobless Claims and the Chicago Fed National Activity Index are expected to show the labor market is cooling.

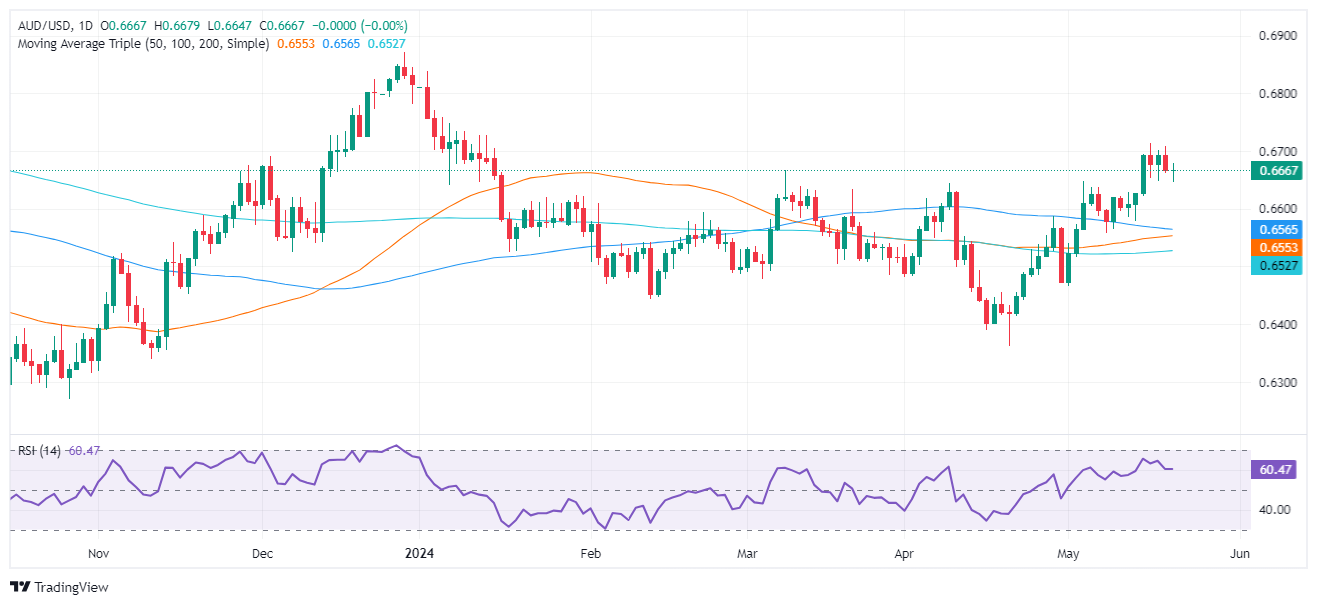
AUD/USD Price Analysis: Technical outlook

The AUD/USD is consolidating around the 0.6600-0.6714 area, with momentum favoring a continuation of the uptrend. The Relative Strength Index (RSI) hints buyers are in charge, though they are taking a breather as the RSI remains flat.

With that said, if buyers reclaim 0.6714, the next resistance level would be January 12 high at 0.6728. Once surpassed, the next stop would be the 0.6800 psychological level, followed by the December 28 high at 0.6871.

Conversely, if sellers drag the AUD/USD exchange rate below 0.6650, look for a retest of 0.6600. Further losses lie at the 100-day moving average (DMA) at 0.6563.

AUD/USD

Overview
Today last price 0.6668
Today Daily Change 0.0001
Today Daily Change % 0.01
Today daily open 0.6667
 
Trends
Daily SMA20 0.6588
Daily SMA50 0.6552
Daily SMA100 0.6566
Daily SMA200 0.6526
 
Levels
Previous Daily High 0.6709
Previous Daily Low 0.6662
Previous Weekly High 0.6714
Previous Weekly Low 0.658
Previous Monthly High 0.6644
Previous Monthly Low 0.6362
Daily Fibonacci 38.2% 0.668
Daily Fibonacci 61.8% 0.6691
Daily Pivot Point S1 0.665
Daily Pivot Point S2 0.6632
Daily Pivot Point S3 0.6603
Daily Pivot Point R1 0.6697
Daily Pivot Point R2 0.6727
Daily Pivot Point R3 0.6745


Disclaimer: For information purposes only. Past performance is not indicative of future results.
placeholder
U.S. November Nonfarm Payrolls: What Does the Rare "Weak Jobs, Strong Economy" Mix Mean for U.S. Equities?1. IntroductionAfter retreating from the late-October highs, U.S. equities embarked on a bottoming rebound in mid-to-late November, a trend driven by the interplay of multiple factors. That said, it i
Author  TradingKey
12 hours ago
1. IntroductionAfter retreating from the late-October highs, U.S. equities embarked on a bottoming rebound in mid-to-late November, a trend driven by the interplay of multiple factors. That said, it i
placeholder
Senate Delays Crypto Market Structure Hearings to Early 2026The Senate Banking Committee has postponed cryptocurrency market structure hearings until 2026, citing ongoing bipartisan negotiations.
Author  Mitrade
17 hours ago
The Senate Banking Committee has postponed cryptocurrency market structure hearings until 2026, citing ongoing bipartisan negotiations.
placeholder
Bitcoin Slides 5% as Sellers Lean In — Can BTC Reclaim $88,000?Bitcoin has dropped back below $88,000 after rolling over from $90,500, with price still trading under the 100-hour Simple Moving Average. The sell-off found a floor at $85,151, and BTC is now consolidating near that base, but rebounds are facing pressure from a bearish trend line around $89,000. Bulls need to retake $88,000–$89,000 to ease downside risk; failure to do so keeps $85,500–$85,000 and then $83,500 in play, with $80,000 as the deeper “line in the sand.” Bitcoin (BTC) is back in damage-control mode after a sharp pullback wiped out recent gains. The price failed to reclaim the $90,000–$90,500 band, rolled over, and slid through $88,500 before briefly dipping under $87,000. Buyers did show up around $85,000, but the rebound so far looks more like stabilization than a clear trend reversal. Bitcoin dips hard, finds a bid near $85,000(h3) BTC’s latest move lower began when it couldn’t build follow-through above $90,000 and $90,500. Once that upside stalled, sellers took control and pushed price down through $88,500. The slide accelerated enough to spike below $87,000, but the market didn’t free-fall. Bulls defended the $85,000 zone, printing a low at $85,151. Since then, Bitcoin has been consolidating below the 23.6% Fibonacci retracement of the drop from the $93,560 swing high to the $85,151 low — a clue that the bounce is still shallow and that sellers haven’t fully backed off yet. Structurally, BTC is still on the back foot: It’s trading below $88,000, and It remains below the 100-hour Simple Moving Average, keeping short-term trend pressure pointed downward. Resistance is layered, and $89,000 is the problem area(h3) If bulls try to turn this into a recovery, they’ll have to climb through multiple ceilings in quick succession. First, BTC faces resistance around $87,150, followed by a more meaningful barrier near $87,500. From there, the market’s attention snaps back to $88,000 — the level BTC just lost and now needs to reclaim. A close back above $88,000 would improve the tone, but it doesn’t solve the bigger issue: there’s a bearish trend line on the hourly BTC/USD chart (Kraken feed) with resistance near $89,000, which also lines up with the next technical hurdle. If BTC can push through $89,000 and hold, the rebound could extend toward $90,000, with follow-through targets at $91,000 and $91,500. But until price clears that $88,000–$89,000 zone, rallies are at risk of being sold rather than chased. If BTC fails to reclaim resistance, the downside path is clear(h3) The near-term bear case is simple: if Bitcoin can’t climb back above the $87,000 area and keep traction, sellers may attempt another leg lower. Support levels line up like this: Immediate support: $85,500 First major support: $85,000 Next support: $83,500 Then $82,500 in the near term Below that, the major “don’t break this” level is still $80,000. If BTC slips under $80,000, the risk of acceleration to the downside increases significantly — not because it’s magic, but because it’s the kind of psychological and structural level that tends to trigger forced de-risking. Indicators: momentum still leans bearish(h3) The intraday indicators aren’t offering much comfort yet: Hourly MACD is losing pace in the bearish zone. Hourly RSI remains below 50, suggesting sellers still have the upper hand on short timeframes. So while the $85,000 defense held for now, the market hasn’t flipped bullish — it’s just stopped bleeding.
Author  Mitrade
20 hours ago
Bitcoin has dropped back below $88,000 after rolling over from $90,500, with price still trading under the 100-hour Simple Moving Average. The sell-off found a floor at $85,151, and BTC is now consolidating near that base, but rebounds are facing pressure from a bearish trend line around $89,000. Bulls need to retake $88,000–$89,000 to ease downside risk; failure to do so keeps $85,500–$85,000 and then $83,500 in play, with $80,000 as the deeper “line in the sand.” Bitcoin (BTC) is back in damage-control mode after a sharp pullback wiped out recent gains. The price failed to reclaim the $90,000–$90,500 band, rolled over, and slid through $88,500 before briefly dipping under $87,000. Buyers did show up around $85,000, but the rebound so far looks more like stabilization than a clear trend reversal. Bitcoin dips hard, finds a bid near $85,000(h3) BTC’s latest move lower began when it couldn’t build follow-through above $90,000 and $90,500. Once that upside stalled, sellers took control and pushed price down through $88,500. The slide accelerated enough to spike below $87,000, but the market didn’t free-fall. Bulls defended the $85,000 zone, printing a low at $85,151. Since then, Bitcoin has been consolidating below the 23.6% Fibonacci retracement of the drop from the $93,560 swing high to the $85,151 low — a clue that the bounce is still shallow and that sellers haven’t fully backed off yet. Structurally, BTC is still on the back foot: It’s trading below $88,000, and It remains below the 100-hour Simple Moving Average, keeping short-term trend pressure pointed downward. Resistance is layered, and $89,000 is the problem area(h3) If bulls try to turn this into a recovery, they’ll have to climb through multiple ceilings in quick succession. First, BTC faces resistance around $87,150, followed by a more meaningful barrier near $87,500. From there, the market’s attention snaps back to $88,000 — the level BTC just lost and now needs to reclaim. A close back above $88,000 would improve the tone, but it doesn’t solve the bigger issue: there’s a bearish trend line on the hourly BTC/USD chart (Kraken feed) with resistance near $89,000, which also lines up with the next technical hurdle. If BTC can push through $89,000 and hold, the rebound could extend toward $90,000, with follow-through targets at $91,000 and $91,500. But until price clears that $88,000–$89,000 zone, rallies are at risk of being sold rather than chased. If BTC fails to reclaim resistance, the downside path is clear(h3) The near-term bear case is simple: if Bitcoin can’t climb back above the $87,000 area and keep traction, sellers may attempt another leg lower. Support levels line up like this: Immediate support: $85,500 First major support: $85,000 Next support: $83,500 Then $82,500 in the near term Below that, the major “don’t break this” level is still $80,000. If BTC slips under $80,000, the risk of acceleration to the downside increases significantly — not because it’s magic, but because it’s the kind of psychological and structural level that tends to trigger forced de-risking. Indicators: momentum still leans bearish(h3) The intraday indicators aren’t offering much comfort yet: Hourly MACD is losing pace in the bearish zone. Hourly RSI remains below 50, suggesting sellers still have the upper hand on short timeframes. So while the $85,000 defense held for now, the market hasn’t flipped bullish — it’s just stopped bleeding.
placeholder
AUD/USD remains depressed below mid-0.6600s; downside seems limited ahead of US NFP reportThe AUD/USD pair attracts some sellers for the fourth straight day on Tuesday and trades around the 0.6630 region, down just over 0.10%, during the Asian session.
Author  FXStreet
21 hours ago
The AUD/USD pair attracts some sellers for the fourth straight day on Tuesday and trades around the 0.6630 region, down just over 0.10%, during the Asian session.
placeholder
Macro Analysts: Hawkish Japan Could Push Bitcoin Below $70KAnalysts predict Bitcoin may face further declines towards the $70,000 mark if the Bank of Japan raises interest rates as expected.
Author  Mitrade
Yesterday 05: 48
Analysts predict Bitcoin may face further declines towards the $70,000 mark if the Bank of Japan raises interest rates as expected.
goTop
quote