GBP/USD Price Analysis: Remains subdued above 1.2700

Source Fxstreet
  • GBP/USD edges up, with buyers eyeing a clear break of the weekly high.
  • Key resistance levels lie at 1.2803, and YTD high at 1.2893.
  • The major can turn bearish below, falling below 1.2681.

The Pound Sterling registered minuscule gains versus the US Dollar in early trading during the North American session. Investors’ sentiment is upbeat as most US equity indices are rising, US Treasury bond yields are falling, and the Greenback was virtually unchanged against a basket of its peers. Therefore, the GBP/USD trades at 1.2719, up 0.11%.

GBP/USD Price Analysis: Technical outlook

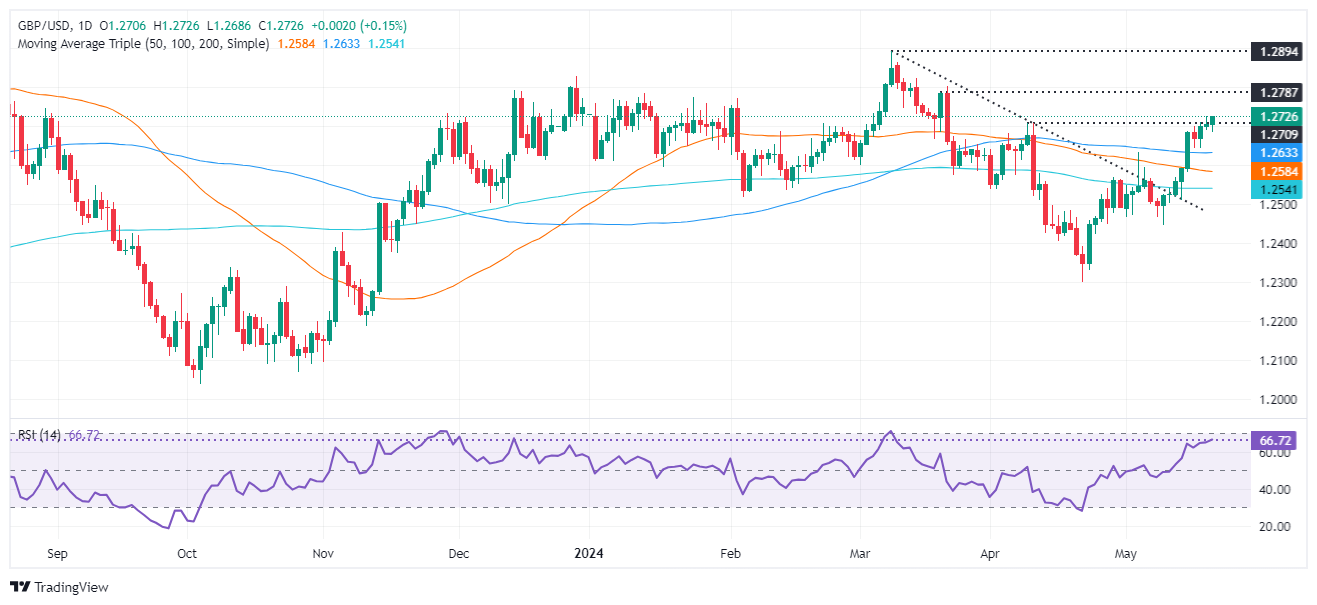
The GBP/USD pair shows a clear upward bias in the near term. While it has yet to print a new weekly high above Monday’s 1.2725, this could potentially pave the way for significant further gains.

Momentum is in favor of the buyers, as depicted by the Relative Strength Index (RSI), which is in bullish territory, though it’s about to turn overbought.

If GBP/USD buyers reclaim 1.2725, that could exacerbate a rally to the next pivot high at 1.2803, the March 21 high. Once surpassed, the next resistance would be the year-to-date (YTD) high at 1.2893.

Conversely, the pair could aim downwards if it registers a daily close below May 20’s low of 1.2681. That can expose the 100-day moving average (DMA) at 1.2634, followed by the 50-DMA at 1.2583.

GBP/USD Price Action – Daily Chart

GBP/USD

Overview
Today last price 1.2721
Today Daily Change 0.0015
Today Daily Change % 0.12
Today daily open 1.2706
 
Trends
Daily SMA20 1.2556
Daily SMA50 1.2585
Daily SMA100 1.2632
Daily SMA200 1.2541
 
Levels
Previous Daily High 1.2726
Previous Daily Low 1.2689
Previous Weekly High 1.2712
Previous Weekly Low 1.2509
Previous Monthly High 1.2709
Previous Monthly Low 1.23
Daily Fibonacci 38.2% 1.2712
Daily Fibonacci 61.8% 1.2703
Daily Pivot Point S1 1.2688
Daily Pivot Point S2 1.2671
Daily Pivot Point S3 1.2652
Daily Pivot Point R1 1.2725
Daily Pivot Point R2 1.2743
Daily Pivot Point R3 1.2761


British Pound PRICE Today

The table below shows the percentage change of British Pound (GBP) against listed major currencies today. British Pound was the strongest against the Canadian Dollar.

  USD EUR GBP JPY CAD AUD NZD CHF
USD   -0.02% -0.14% -0.17% 0.13% -0.10% 0.07% -0.09%
EUR 0.02%   -0.13% -0.14% 0.13% -0.08% 0.07% -0.07%
GBP 0.14% 0.13%   -0.04% 0.28% 0.04% 0.20% 0.05%
JPY 0.17% 0.14% 0.04%   0.31% 0.07% 0.22% 0.08%
CAD -0.13% -0.13% -0.28% -0.31%   -0.23% -0.07% -0.23%
AUD 0.10% 0.08% -0.04% -0.07% 0.23%   0.16% 0.03%
NZD -0.07% -0.07% -0.20% -0.22% 0.07% -0.16%   -0.15%
CHF 0.09% 0.07% -0.05% -0.08% 0.23% -0.03% 0.15%  

The heat map shows percentage changes of major currencies against each other. The base currency is picked from the left column, while the quote currency is picked from the top row. For example, if you pick the British Pound from the left column and move along the horizontal line to the US Dollar, the percentage change displayed in the box will represent GBP (base)/USD (quote).


Disclaimer: For information purposes only. Past performance is not indicative of future results.
placeholder
BTC Hovers Near 60,000 Mark After Plunge. US May CPI Set to Be Revealed, How Is Wall Street Betting?Bitcoin's rebound falters as the U.S.-Iran conflict and CPI data likely sustain downward pressure.On June 10, escalating U.S.-Iran tensions put the already fragile crypto market to the te
Author  TradingKey
11 hours ago
Bitcoin's rebound falters as the U.S.-Iran conflict and CPI data likely sustain downward pressure.On June 10, escalating U.S.-Iran tensions put the already fragile crypto market to the te
placeholder
Gold plummets below $4,200 as US‑Iran tensions spur hawkish rate bets ahead of US CPIGold (XAU/USD) extends the recent breakdown momentum below a technically significant 200-day Simple Moving Average (SMA) and drops to a fresh low since March 23, further below the $4,200 mark during the Asian session on Wednesday.
Author  FXStreet
12 hours ago
Gold (XAU/USD) extends the recent breakdown momentum below a technically significant 200-day Simple Moving Average (SMA) and drops to a fresh low since March 23, further below the $4,200 mark during the Asian session on Wednesday.
placeholder
Gold Prices Fall for Four Consecutive Months, Has the Precious Metals Bull Market Partially Ended? Where Is the Next Support Level?Gold Prices ( XAUUSD) Slump for Four Consecutive Months: Has the Precious Metals Bull Market Partially Ended? Where Is the Next Support Level?Year-to-date, international gold prices have
Author  TradingKey
13 hours ago
Gold Prices ( XAUUSD) Slump for Four Consecutive Months: Has the Precious Metals Bull Market Partially Ended? Where Is the Next Support Level?Year-to-date, international gold prices have
placeholder
WTI steadies around $87.50 despite renewed supply concernsWest Texas Intermediate (WTI) oil price experiences volatility after registering over 2.5% losses in the previous day, trading around $87.40 per barrel during the Asian hours on Wednesday.
Author  FXStreet
19 hours ago
West Texas Intermediate (WTI) oil price experiences volatility after registering over 2.5% losses in the previous day, trading around $87.40 per barrel during the Asian hours on Wednesday.
placeholder
US May CPI Preview: Rising Inflation May Push Up Fed Rate Hike Expectations, How Will US Stocks, Dollar, Gold React? The U.S. Bureau of Labor Statistics will release May CPI data at 8:30 AM ET on June 10. This report is the most critical inflation reading ahead of the Federal Reserve's policy meeting on
Author  TradingKey
Yesterday 09: 55
The U.S. Bureau of Labor Statistics will release May CPI data at 8:30 AM ET on June 10. This report is the most critical inflation reading ahead of the Federal Reserve's policy meeting on
Related Instrument
goTop
quote