

EUR/GBP drifts below 0.8550 as rate cut expectations weigh on Euro
- EUR/GBP fell to a 20-day low, dips below 0.8550.
- ECB summer rate cuts increasingly expected.
- Key UK data due this week, UK inflation and PMIs on the cards.
EUR/GBP dropped further on Monday, receding below 0.8550 as the Euro (EUR) sheds weight against the Pound Sterling (GBP) with the European Central Bank (ECB) stepping closer towards making a first rate cut in June or July. Talking points from ECB officials are giving mixed signals to markets, deflating the Euro as investors grapple with inconsistent messaging from central planners.
Rate doves from the ECB have stepped to the forefront recently, led by comments from ECB policymaker Martins Kazaks. Kazaks noted on Monday that June is a likely starting point for rate cuts. ECB Kazak’s comments muddy the waters on ECB messaging in recent weeks, which have run the gamut from advising further caution on rate moves, to some policymakers floating a possible start to rate cuts in July.
With the ECB increasingly likely to trim rates as soon as July, the rate differential between the ECB and the Bank of England (BoE) threatens to widen, softening the Euro against the Pound.
Key UK inflation data due this week will help traders gauge the BoE’s rate outlook. UK COnsumer Price Index (CPI) inflation is due on Wednesday, and is expected to ease to 2.1% YoY in April from the previous 3.2%. Later in the week, Purchasing Managers Index (PMI) results are expected from both the EU and the UK. UK Retail Sales will round out the trading week on Friday.
EUR/GBP technical outlook
EUR/GBP is accelerating a downside tumble below the 200-hour Exponential Moving Average (EMA) after dropping through the key technical indicator near 0.8590. The 200-hour EMA is turning bearish into 0.8577, and the pair is bidding further into bear country below 0.8550.
Despite a near-term downturn, EUR/GBP remains trapped in familiar consolidation. The pair is chewing on volatility-plagued chart paper as the EUR/GBP battles with repeated technical rejections from the 200-day EMA near the 0.8600 handle.
EUR/GBP hourly chart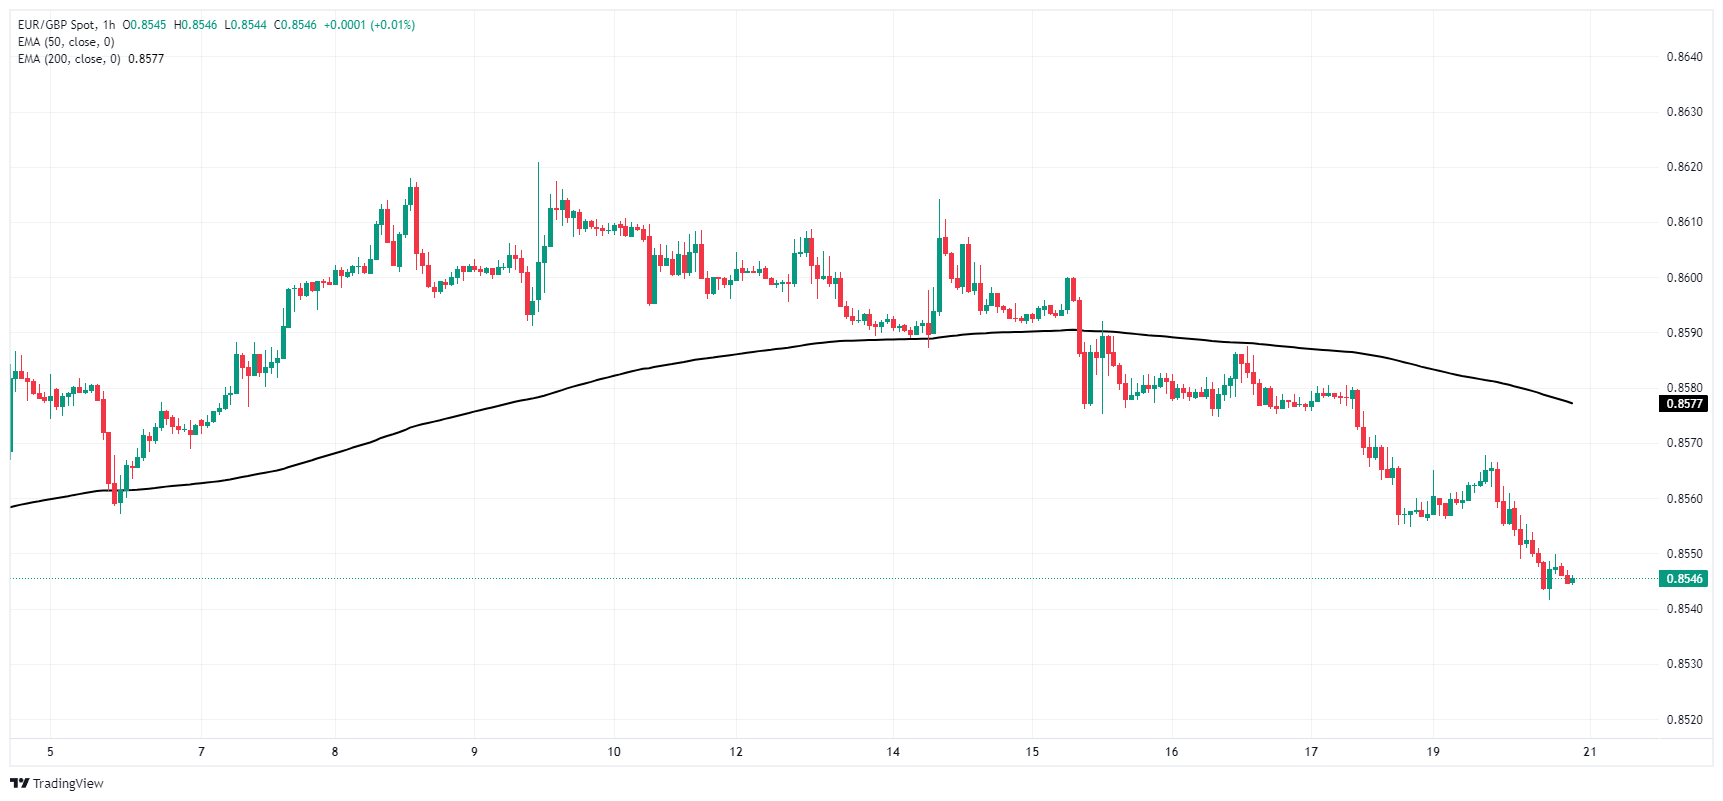
EUR/GBP daily chart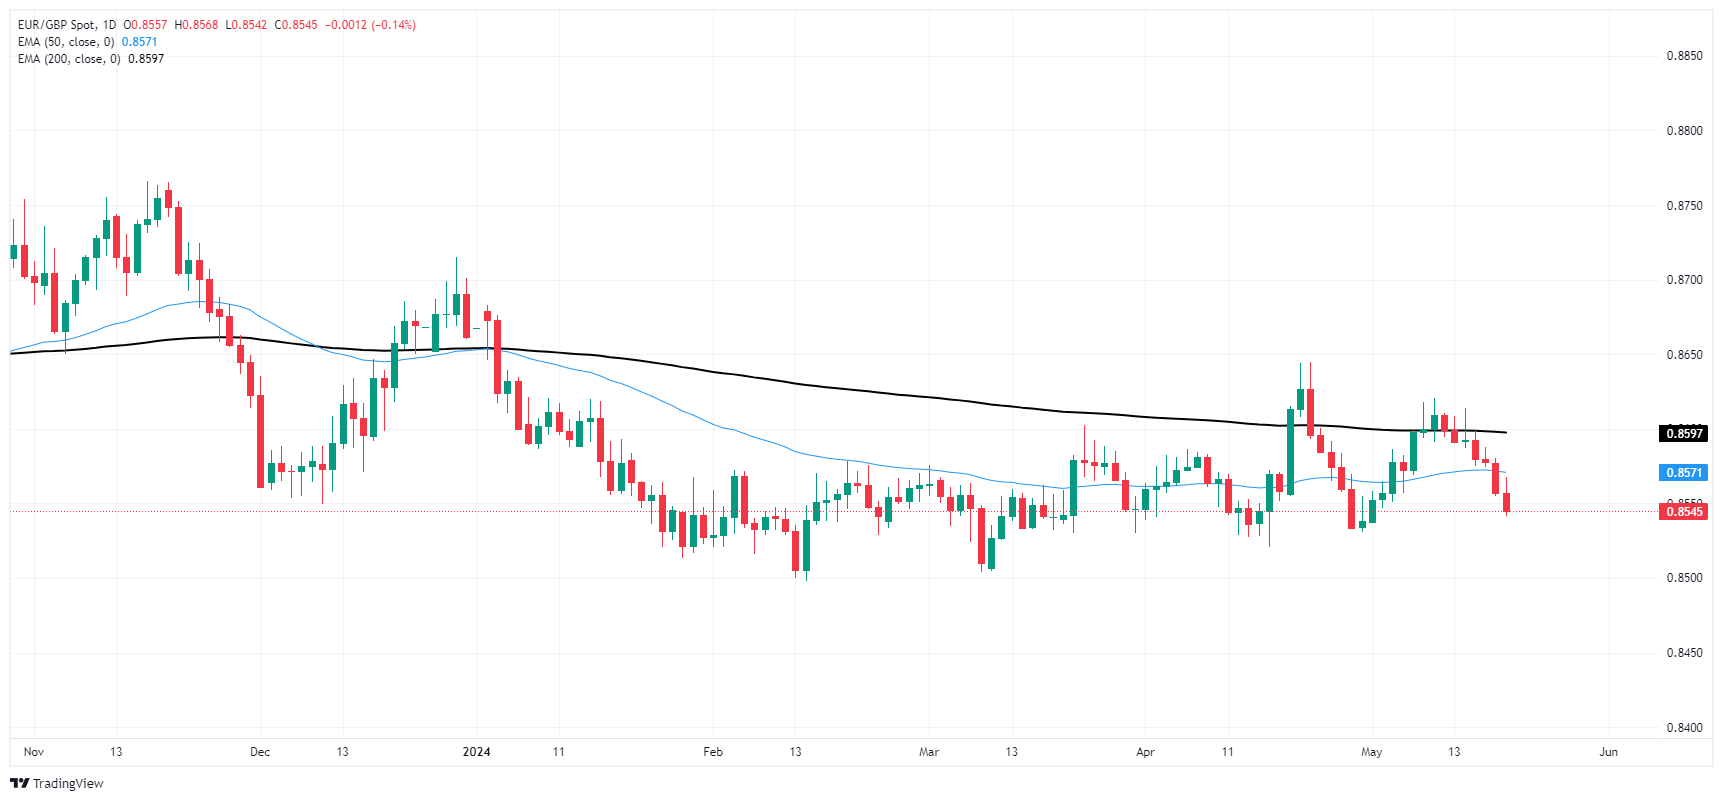
Recommended Articles


