AUD/USD Price Analysis: Uptrend bias continues

Source Fxstreet
  • AUD/USD has continued trending higher and almost retested the highs of May. 
  • A clear break above 0.6714 would confirm a continuation of the short-term uptrend. 
  • Only a break below the red trendline would bring into question the dominant uptrend. 

AUD/USD was pulling back but it found support and rallied back up to within a few pips of the May 16 high at 0.6714. 

The Aussie is in a short-term uptrend indicated by the rising peaks and troughs on the four-hour chart since the April 19 lows. Given the old saying that “the trend is your friend” the odds favor an extension of the uptrend.

A break above the May 16 high will create a higher high and confirm an extension of the short-term uptrend. 

AUD/USD 4-hour Chart

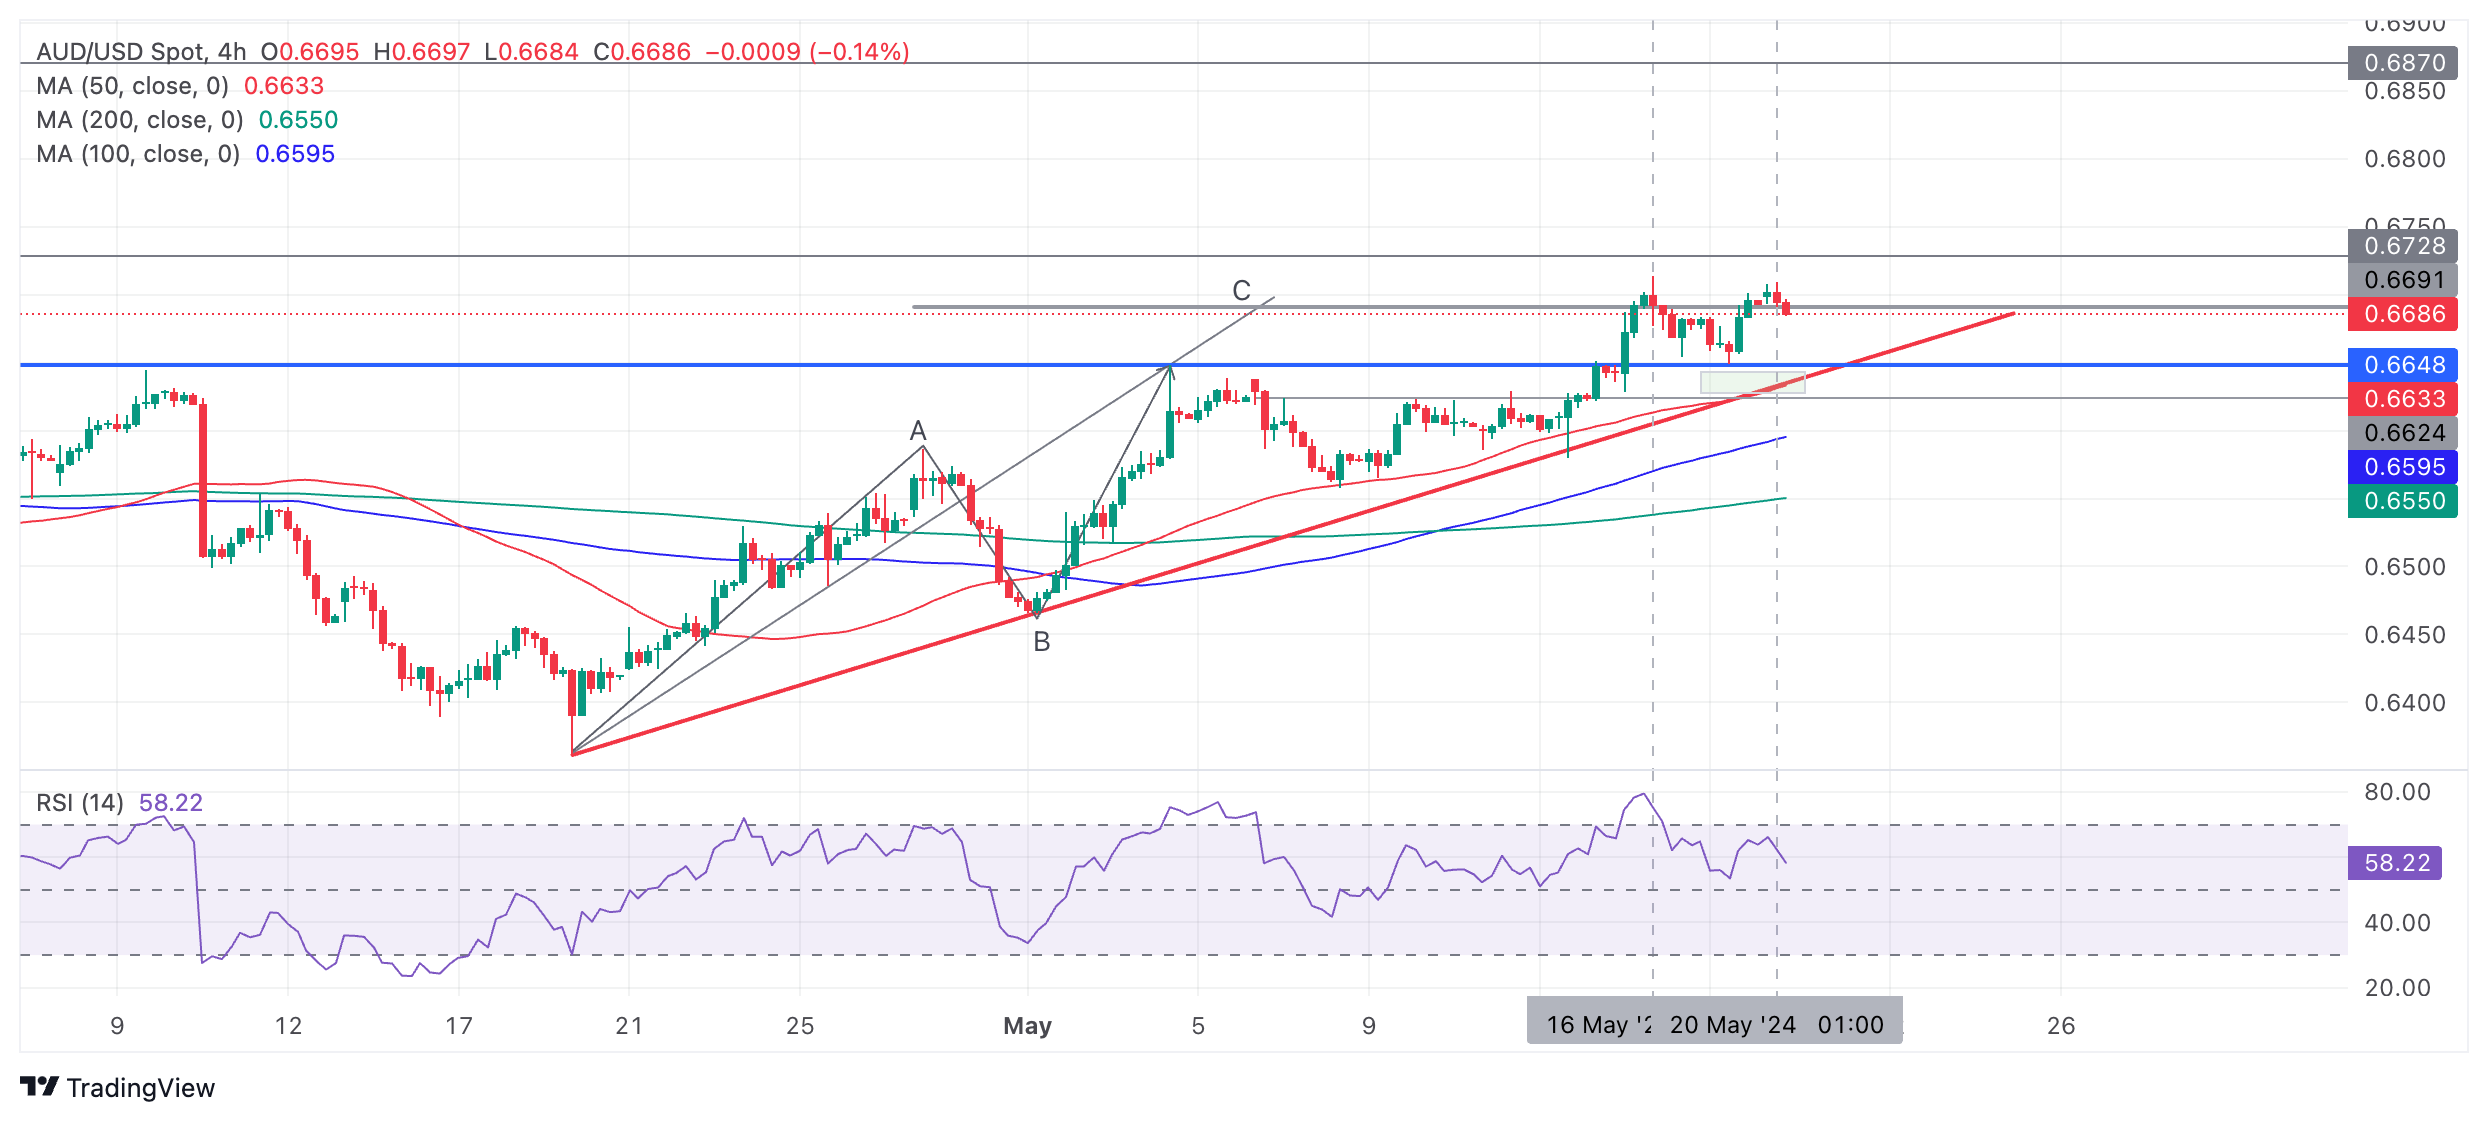
The next target to the upside would be 0.6728, a previous high, followed by 0.6870, an old resistance level. 

AUD/USD achieved the target for the Measured Move pattern it formed from the April 19 lows at the May 16 highs of the month. Measured moves are zig-zag like patterns composed of three waves, usually labeled A, B and C. The general expectation is that wave C will reach either the same length as A (or a Fibonacci ratio of A) which it succeeded in doing when it peaked at 0.6714.

The Relative Strength Index (RSI) is much lower at the May 20 high compared to the May 16 high. The difference is a soft divergence but because price has not made a higher high on May 20 yet, it cannot be counted as pure divergence. Nevertheless, it is a mildly bullish sign that suggests an increased possibility of a pull back.

It would require a clear break below the 0.6649 May 17 lows to indicate the trend was weakening.

A decisive break below the red trendline would be a much more bearish sign which could denote a change of the short-term trend.

Decisive would be characterized as a break that was accompanied by a long red candle that closed near its low or three red candles in a row that broke through the trendline.

Disclaimer: For information purposes only. Past performance is not indicative of future results.
placeholder
Nvidia Earnings Approach: Can It Drive a Nasdaq Rebound? What Should Investors Watch Most?On May 20, ET, NVIDIA ( NVDA )'s first-quarter fiscal 2026 earnings report, to be released after the market close, has become the market focus. The options market has already reacted; bas
Author  TradingKey
11 hours ago
On May 20, ET, NVIDIA ( NVDA )'s first-quarter fiscal 2026 earnings report, to be released after the market close, has become the market focus. The options market has already reacted; bas
placeholder
Gold Prices Fall Below Key $4,500 Mark, US Treasury Yields Rise for Seventh Day, Gold May Fall to $4,100On Tuesday (May 19), gold ( XAUUSD) closed at $4,481.89. The price confirmed a break below $4,500, further opening up the downside. On Wednesday, gold extended its downward trend from the
Author  TradingKey
18 hours ago
On Tuesday (May 19), gold ( XAUUSD) closed at $4,481.89. The price confirmed a break below $4,500, further opening up the downside. On Wednesday, gold extended its downward trend from the
placeholder
Gold falls below $4,500 on rising global rate hike bets Gold price (XAU/USD) faces some selling pressure near $4,480 during the early Asian session on Wednesday. The precious metal drops to its lowest since March 30 as persistent inflation fears keep interest rate hike expectations and Treasury yields high.
Author  FXStreet
20 hours ago
Gold price (XAU/USD) faces some selling pressure near $4,480 during the early Asian session on Wednesday. The precious metal drops to its lowest since March 30 as persistent inflation fears keep interest rate hike expectations and Treasury yields high.
placeholder
Bitcoin Price Forecast: BTC battles at key technical zone amid mixed flow signalsBitcoin (BTC) steadies around the key technical support on Tuesday after its recent correction. The Crypto King’s next directional move could hinge on this key technical zone.
Author  FXStreet
Yesterday 10: 07
Bitcoin (BTC) steadies around the key technical support on Tuesday after its recent correction. The Crypto King’s next directional move could hinge on this key technical zone.
placeholder
WTI declines below $102.00 after Trump says he called off Iran attacksWest Texas Intermediate (WTI), the US crude oil benchmark, is trading around $101.85 during the early Asian trading hours on Tuesday. The WTI price declines after US President Donald Trump said he was holding off a military attack on Iran planned for Tuesday at the request of Gulf states.
Author  FXStreet
Yesterday 01: 17
West Texas Intermediate (WTI), the US crude oil benchmark, is trading around $101.85 during the early Asian trading hours on Tuesday. The WTI price declines after US President Donald Trump said he was holding off a military attack on Iran planned for Tuesday at the request of Gulf states.
Related Instrument
goTop
quote