NZD/USD Price Analysis: Buyers take a breather after Wednesday’s rally, outlook remains positive

Source Fxstreet
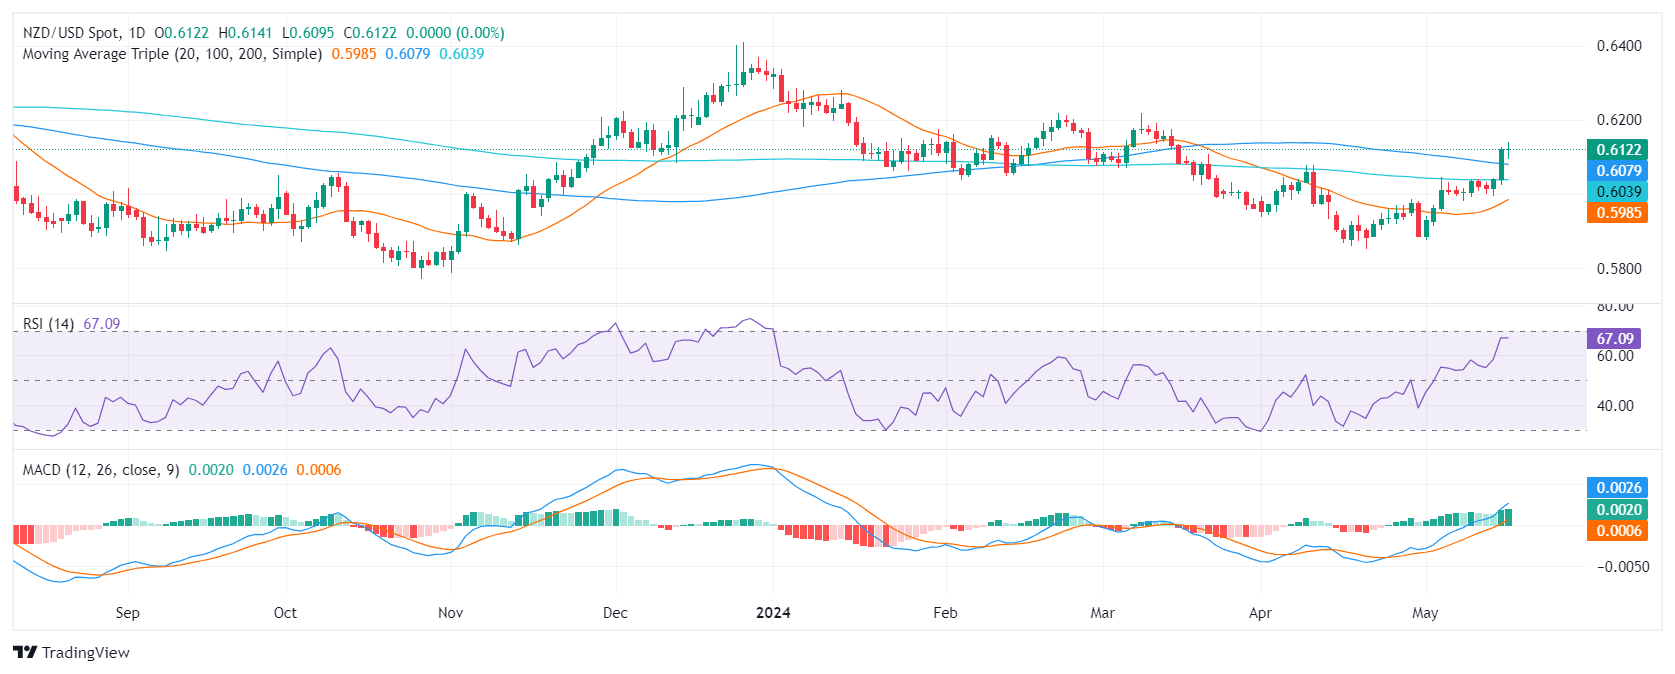
  • The daily RSI shows that the pair has strong positive momentum, approaching overbought conditions but turning flat.
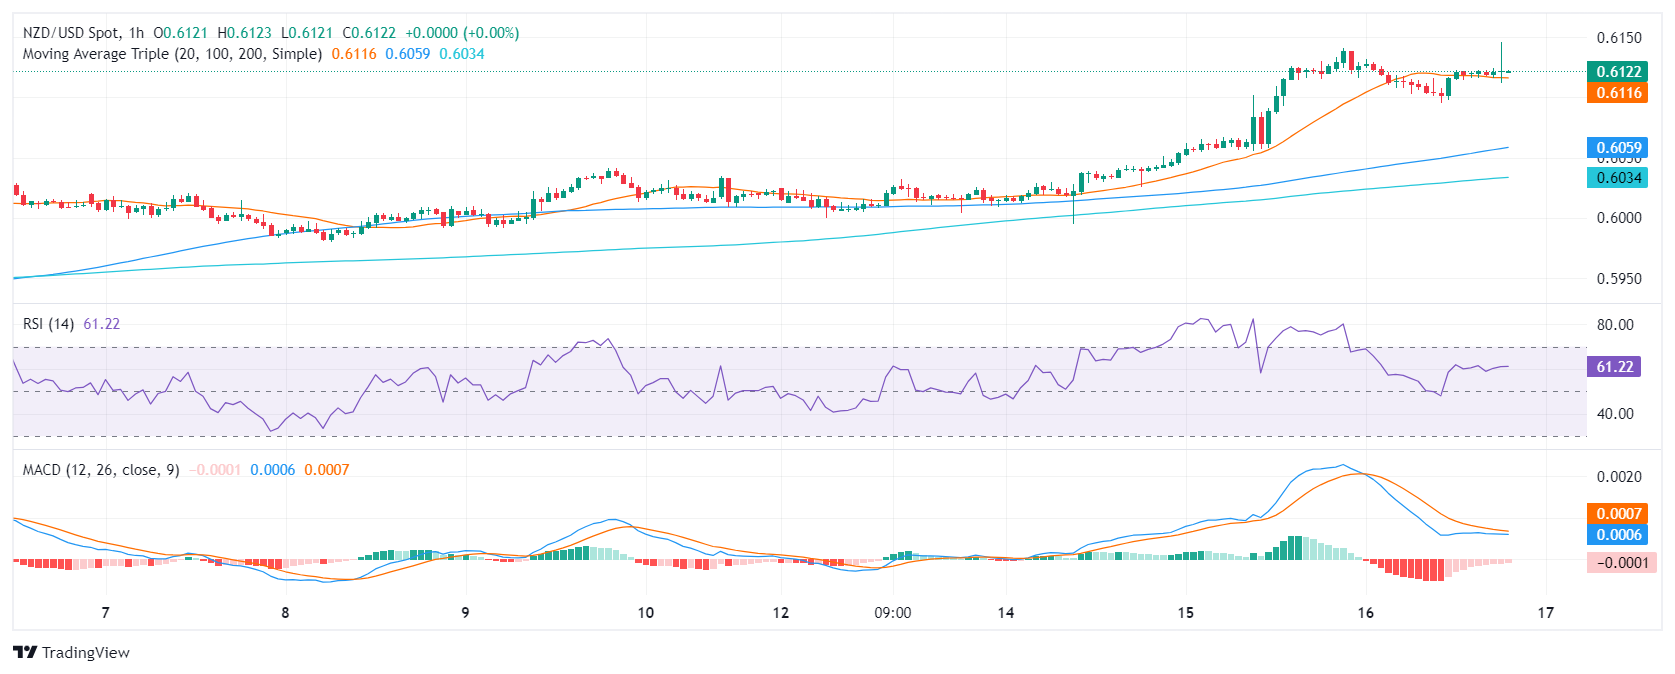
  • Hourly RSI indicates a slight retreat, hinting at some short-term consolidation.
  • The pair remains firm above its main SMAs, signaling a solid bullish sentiment in the near and distant future.

On Thursday's session, the NZD/USD remained flat at around 0.6120, as investors seem to be taking profits. After the Kiwi jumped above its main Simple Moving Averages (SMAs) the outlook turned bullish for the pair, but further consolidation may be in the horizon.

On the daily chart, the Relative Strength Index (RSI) shows positive momentum, fluctuating within positive territory, and nearing overbought status but turned flat on Thursday. The green bars of the Moving Average Convergence Divergence (MACD) reinforce the positive trend but are also flattened.

NZD/USD daily chart

Moving to the hourly chart, mixed signals are visible. The RSI retreated slightly after being deep in overbought terrain, revealing a subtle slowdown in buying enthusiasm in recent hours. The red bars of the MACD suggest that the buying traction was weak in the last hours.

NZD/USD hourly chart

To conclude, bearing in mind the positive RSI indicators and the green MACD histogram, alongside the currency pair being above critical SMAs, the market seems to favor the bulls for the NZD/USD pair in both the short and long term but further consolidation shouldn’t be taken off the table. However, the conquered 100- and 200-day SMA will be a strong support that could limit losses.

NZD/USD

Overview
Today last price 0.6122
Today Daily Change 0.0000
Today Daily Change % 0.00
Today daily open 0.6122
 
Trends
Daily SMA20 0.5974
Daily SMA50 0.6009
Daily SMA100 0.6081
Daily SMA200 0.6038
 
Levels
Previous Daily High 0.6126
Previous Daily Low 0.6025
Previous Weekly High 0.6041
Previous Weekly Low 0.598
Previous Monthly High 0.6079
Previous Monthly Low 0.5851
Daily Fibonacci 38.2% 0.6088
Daily Fibonacci 61.8% 0.6064
Daily Pivot Point S1 0.6056
Daily Pivot Point S2 0.599
Daily Pivot Point S3 0.5956
Daily Pivot Point R1 0.6157
Daily Pivot Point R2 0.6192
Daily Pivot Point R3 0.6258


Disclaimer: For information purposes only. Past performance is not indicative of future results.
placeholder
Ethereum (ETH) Price Closes Above $3,900 — Is a New All-Time High Possible Before 2024 Ends?Once again, the price of Ethereum (ETH) has risen above $3,900. This bounce has hinted at a further price increase for the altcoin before the end of the year.
Author  Beincrypto
Dec 17, 2024
Once again, the price of Ethereum (ETH) has risen above $3,900. This bounce has hinted at a further price increase for the altcoin before the end of the year.
placeholder
Markets in 2026: Will gold, Bitcoin, and the U.S. dollar make history again? — These are how leading institutions thinkAfter a turbulent 2025, what lies ahead for commodities, forex, and cryptocurrency markets in 2026?
Author  Insights
Dec 25, 2025
After a turbulent 2025, what lies ahead for commodities, forex, and cryptocurrency markets in 2026?
placeholder
Gold Price Forecast: XAU/USD falls below $5,050 as traders await US jobs data Gold price (XAU/USD) attracts some sellers near $5,035 during the early Asian session on Tuesday. The precious metal edges lower amid improved risk sentiment and some profit-taking. Traders brace for key US economic data later this week, including delayed employment and inflation reports. 
Author  FXStreet
Feb 10, Tue
Gold price (XAU/USD) attracts some sellers near $5,035 during the early Asian session on Tuesday. The precious metal edges lower amid improved risk sentiment and some profit-taking. Traders brace for key US economic data later this week, including delayed employment and inflation reports. 
placeholder
Gold climbs to $5,050 as Fed-driven USD weakness offsets positive risk tone ahead of US NFPGold (XAU/USD) attracts some dip-buyers following the previous day's modest slide and climbs back above the $5,050 level during the Asian session on Wednesday.
Author  FXStreet
Feb 11, Wed
Gold (XAU/USD) attracts some dip-buyers following the previous day's modest slide and climbs back above the $5,050 level during the Asian session on Wednesday.
placeholder
Financial Markets 2026: Volatility Catalysts in Gold, Silver, Oil, and Blue-Chip Stocks—A CFD Trader's OutlookThe financial world is perpetually in motion, but the landscape for 2026 seems to be shaping up to be particularly dynamic. For CFD traders navigating global markets, this heightened volatility could present a distinctive set of challenges and opportunities.
Author  Rachel Weiss
Yesterday 05: 31
The financial world is perpetually in motion, but the landscape for 2026 seems to be shaping up to be particularly dynamic. For CFD traders navigating global markets, this heightened volatility could present a distinctive set of challenges and opportunities.
Related Instrument
goTop
quote