

EUR/USD lurches back over 1.0800 ahead of hectic Wednesday
- EUR/USD recovered ground after hesitating early Tuesday.
- US PPI inflation ticked higher in the near-term, but rate cut bets hold steady.
- EU GDP growth, US CPI inflation prints due Wednesday.
EUR/USD recovered ground on Tuesday, vaulting back over the 1.0800 handle and settling near 1.0820 at the tail end of the American market session. The pair is heading into a densely-packed economic data docket on Wednesday, with European Gross Domestic Product (GDO) and US Consumer Price Index (CPI) inflation figures due throughout the day.
US Producer Price Index (PPI) figures came in mostly as-expected on Tuesday, with annualized Core PPI printing at the forecast 2.4% YoY, but this figure showed a near-term uptick in prices after the previous period’s figure was revised down to 2.1% from the initial print of 2.4%.
Read more: US annual PPI inflation rises to 2.2% in April as expected
May’s pan-European ZEW Economic Sentiment Survey results helped to bolster the Euro after a cautious step forward in consumer sentiment. The ZEW Economic Sentiment Survey improved to 47.0, above the forecast 46.1 and rising from the previous month’s 43.9. The survey printed at its highest figure since February of 2022.
Coming up on Wednesday, European GDP growth is expected to come in at 0.3% in the first quarter. Annualized GDP growth is likewise forecast to hold steady at 0.4% QoY.
US CPI inflation on Wednesday is expected to hold steady at 0.4% MoM, with YoY CPI in April forecast to tick down to 3.4% from the previous 3.5%. Core CPI inflation will draw investor eyes, and is forecast to tick down to 3.6% YoY versus the previous 3.8%. US Retail Sales are also expected to cool off slightly, with April’s MoM Retail Sales expected to grow 0.4% compared to the previous 0.7%.
EUR/USD technical outlook
EUR/USD’s Tuesday jump dragged the pair further into near-term bullish territory, recovering above 1.0800 and clipping into the pair’s highest bids since early April. The pair has been on a wobbly recovery from the last major swing low into the 1.0600 handle, rising over 2% since mid-April.
Tuesday’s bullish bid has pushed the pair back over the 200-day Exponential Moving Average (EMA) at 1.0797, but a firm pattern of lower highs is weighing on the EUR/USD with the last swing high failing to capture the 1.0900 level.
EUR/USD hourly chart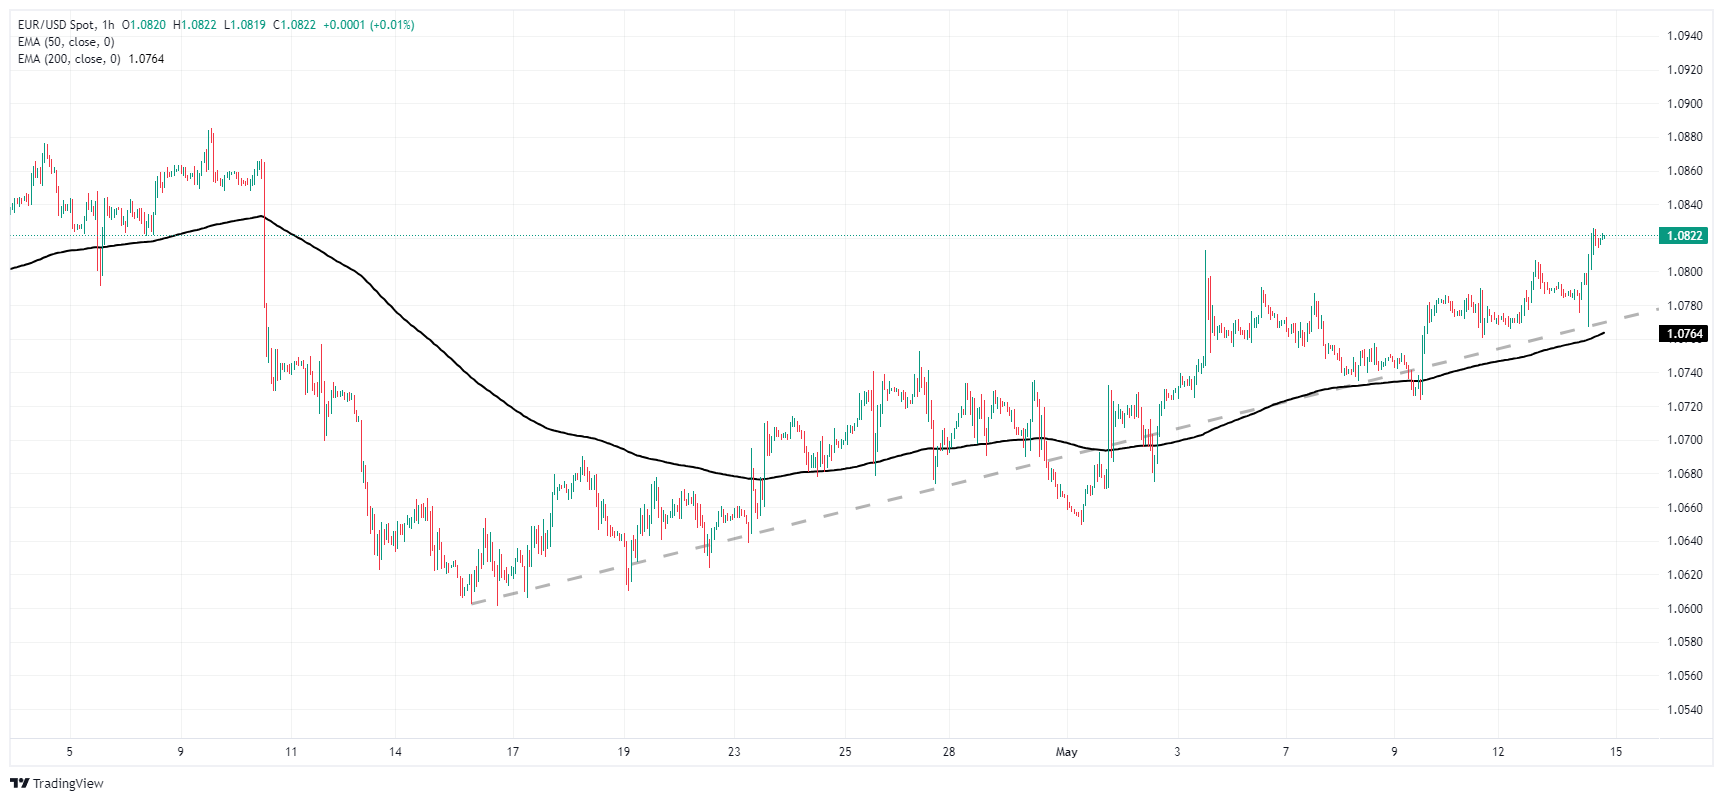
EUR/USD daily chart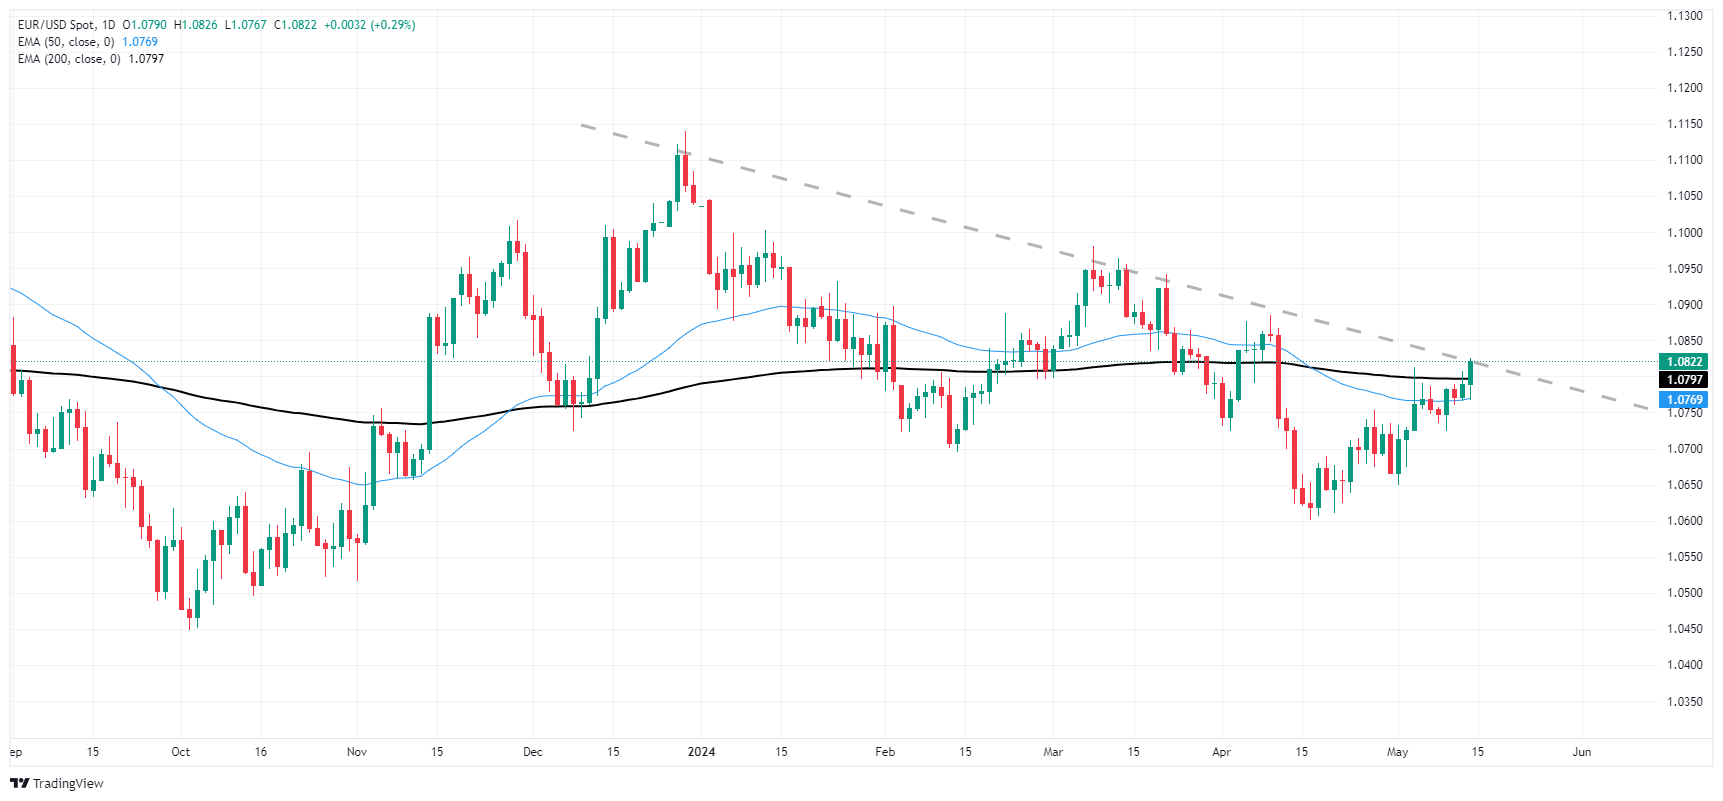
Recommended Articles


