USD/NOK continues losing ground after US PPI, CPI data looms

Source Fxstreet
  • Jerome Powell stated on Tuesday that his confidence in inflation coming down is lower.
  • The US reported that April’s PPI aligned with expectations.
  • April’s CPI and Retail Sales will define the outlook of the USD.

The USD/NOK pair is trading lower on Tuesday. Overall, the USD strength persists despite a mild bearish pressure and Jerome Powell confirmed its wait-and-watch approach by the bank.

The US economy continues to showcase considerable strength, with persistent indications of a resilient labor market and sustained consumer spending, as noted by Federal Reserve Chairman Jerome Powell on Tuesday. His sentiment, however, carried a note of caution regarding the dilemma of inflation and the subsequent need for consistency in implementing restrictive policies.

On the data front, the US Producer Price Index (PPI) figures resonated with these insights, reporting a year-on-year increase of 2.2% in April, in conformity with market forecasts. On Wednesday, the US will report April's Consumer Price Index (CPI) which is expected to have shown a deceleration and will shape the expectations for the next Fed decision. As for now, the kick-off of the easing is seen starting in September.

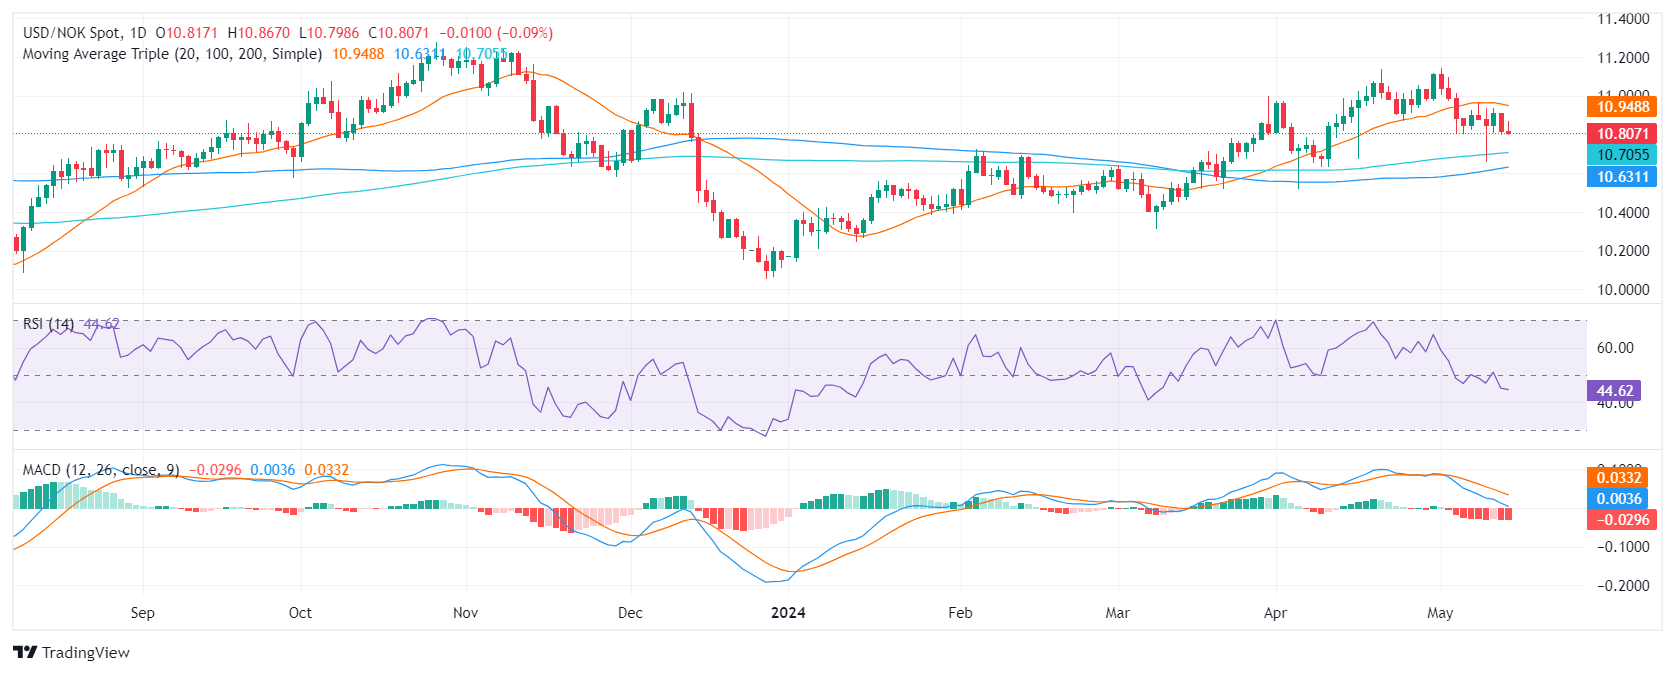
USD/NOK technical analysis

On the daily chart, the Relative Strength Index (RSI) is oscillating within negative territory, signaling that sellers may continue to control the market. Despite a brief shift in momentum on Monday, with the RSI hitting 50.99, the most recent session sees the RSI at 46.20, suggesting a continuation of the bearish sentiment. The Moving Average Convergence Divergence (MACD) histogram further bolsters this sentiment, with its red bars increasing, indicative of a growing bearish momentum.

USD/NOK

Overview
Today last price 10.8083
Today Daily Change -0.0088
Today Daily Change % -0.08
Today daily open 10.8171
 
Trends
Daily SMA20 10.9574
Daily SMA50 10.7962
Daily SMA100 10.6245
Daily SMA200 10.7028
 
Levels
Previous Daily High 10.9094
Previous Daily Low 10.7964
Previous Weekly High 10.9612
Previous Weekly Low 10.6571
Previous Monthly High 11.1373
Previous Monthly Low 10.518
Daily Fibonacci 38.2% 10.8396
Daily Fibonacci 61.8% 10.8663
Daily Pivot Point S1 10.7726
Daily Pivot Point S2 10.728
Daily Pivot Point S3 10.6596
Daily Pivot Point R1 10.8855
Daily Pivot Point R2 10.954
Daily Pivot Point R3 10.9985


Disclaimer: For information purposes only. Past performance is not indicative of future results.
placeholder
Markets in 2026: Will gold, Bitcoin, and the U.S. dollar make history again? — These are how leading institutions thinkAfter a turbulent 2025, what lies ahead for commodities, forex, and cryptocurrency markets in 2026?
Author  Insights
Dec 25, 2025
After a turbulent 2025, what lies ahead for commodities, forex, and cryptocurrency markets in 2026?
placeholder
ECB Policy Outlook for 2026: What It Could Mean for the Euro’s Next MoveWith the ECB likely holding rates steady at 2.15% and the Fed potentially extending cuts into 2026, EUR/USD may test 1.20 if Eurozone growth proves resilient, but weaker growth and an ECB pivot could pull the pair back toward 1.13 and potentially 1.10.
Author  Mitrade
Dec 26, 2025
With the ECB likely holding rates steady at 2.15% and the Fed potentially extending cuts into 2026, EUR/USD may test 1.20 if Eurozone growth proves resilient, but weaker growth and an ECB pivot could pull the pair back toward 1.13 and potentially 1.10.
placeholder
My Top 5 Stock Market Predictions for 2026Five 2026 market predictions written in a native, news-style voice: AI’s winners and losers, broader sector leadership, dividend demand, valuation cooling as the Shiller CAPE sits at 39 (Dec. 31, 2025), and quantum-computing bursts—while keeping all original facts and numbers unchanged.
Author  Mitrade
Jan 06, Tue
Five 2026 market predictions written in a native, news-style voice: AI’s winners and losers, broader sector leadership, dividend demand, valuation cooling as the Shiller CAPE sits at 39 (Dec. 31, 2025), and quantum-computing bursts—while keeping all original facts and numbers unchanged.
placeholder
Gold eases from four-week top as Hormuz risks temper USD weaknessGold (XAU/USD) hits a nearly four-week high during the Asian session on Wednesday, though it lacks follow-through buying and currently trades just below the $4,850 level, nearly unchanged for the day.
Author  FXStreet
Apr 15, Wed
Gold (XAU/USD) hits a nearly four-week high during the Asian session on Wednesday, though it lacks follow-through buying and currently trades just below the $4,850 level, nearly unchanged for the day.
placeholder
WTI drifts higher to near $89.00 amid Lebanon-Israel ceasefire strains West Texas Intermediate (WTI), the US crude oil benchmark, is trading around $89.00 during the Asian trading hours on Friday. The WTI price edges higher after reports that Lebanon's army accuses Israel of violating the ceasefire. 
Author  FXStreet
8 hours ago
West Texas Intermediate (WTI), the US crude oil benchmark, is trading around $89.00 during the Asian trading hours on Friday. The WTI price edges higher after reports that Lebanon's army accuses Israel of violating the ceasefire. 
Related Instrument
goTop
quote