


Japanese Yen eases amid uncertainty over BoJ extending policy-tightening spell
- The Japanese Yen drops further as investors remain uncertain about BoJ extending the policy normalization process.
- Japan’s economy is estimated to have contracted by 0.4% in the January-March period, exhibiting a weak start to the year.
- The US Dollar will dance to the tunes of the US consumer and producer inflation data.
The Japanese Yen (JPY) falls further to 156.00 against the US Dollar (USD) in Monday’s European session. The USD/JPY pair moves upwards as investors worry that rising inflation in the Japanese economy is mainly the outcome of a weak Yen, which should be driven by a wage growth spiral for price pressures to sustain steadily above the desired rate of 2%.
The communication from Bank of Japan’s (BoJ) Summary of Opinions (SOP) for the April meeting, released last week, indicated that inflationary pressures in Japan are majorly induced by weak Yen. Policymakers discussed possible scenarios for further rate hikes. One member said the extent of consumption recovery toward the latter half of this year will be key in considering the timing for the next policy change.
This week, the outlook of the Japanese Yen will be guided by preliminary Japan’s Q1 Gross Domestic Product (GDP) data, which will be published on Thursday. The consensus suggests that the Japanese economy contracted by 0.4% in the January-March period after expanding by 0.1% in the last quarter of 2023. On an annualized basis, the Japanese economy is estimated to have contracted significantly by 1.5%.
Daily digest market movers: Japanese Yen weakens despite subdued USD
- The Japanese Yen extends its downside to near 156.00 against the US Dollar even though the Greenback is on the back foot due to deepening concerns over the United States labor market strength after weak Nonfarm Payrolls (NFP) for April, lower Job Openings for March and a large number of individuals claiming jobless benefits for the first time for the week ending May 3. The US Dollar Index (DXY), which tracks the US Dollar’s value against six major currencies, is slightly down below 105.30.
- In the current scenario, easing tight labor market conditions is unfavorable for the US Dollar and bond yields as it exhibits softening inflation outlook, which strengthens speculation for the US Federal Reserve (Fed) returning to policy normalization. The CME FedWatch tool shows that the September meeting will be the earliest when interest rates will be lowered from their current range of 5.25%-5.50%.
- This week, investors will focus on the US Producer Price Index (PPI), Consumer Price Index (CPI) and Retail Sales data for April. The US PPI data releasing on Tuesday will exhibit the change in prices of goods and services by business owners. On Wednesday, consumer inflation and Retail Sales data will be released, which will provide fresh cues on the interest rate outlook.
- Economists expect that monthly headline and core CPI rose by 0.3% in April, slower than March’s reading of 0.4%. Annual headline CPI is forecasted to have softened to 3.4% from 3.5% in March. In the same period, the core inflation that strips off volatile food and energy prices is anticipated to have decelerated to 3.6% from the prior reading of 3.8%.
- Hot inflation data will offset investors’ optimism for Fed rate cuts in September built on easing labor market data. On the contrary, soft inflation figures will strengthen investors’ confidence in the Fed reducing interest rates from September. Traders could raise bets for the Fed to start lowering borrowing rates in July if the inflation data decelerates more than expected.
Technical Analysis: Japanese Yen retraces 50% downside move from multi-year low of 160.32
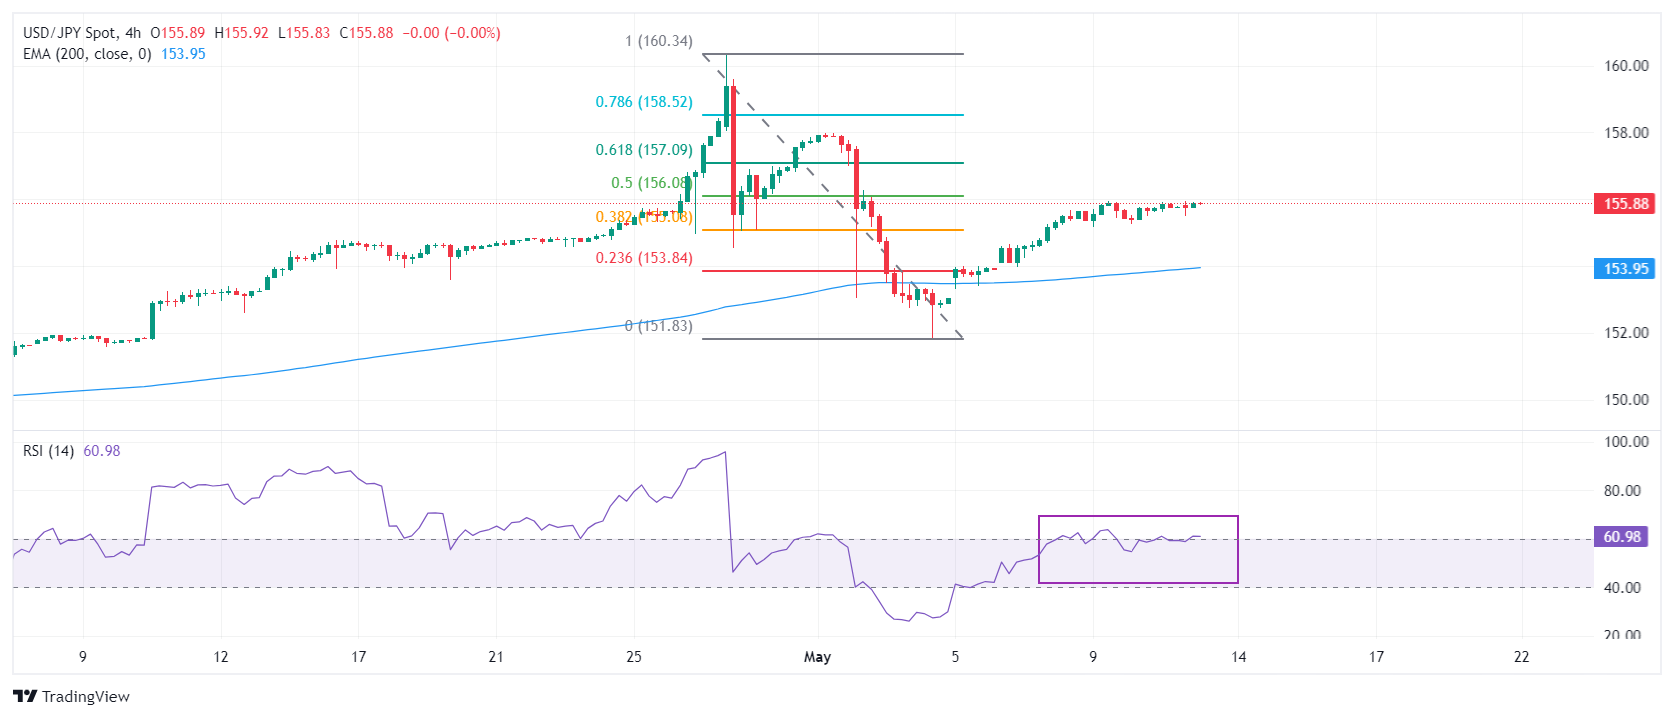
The Japanese Yen retraces 50% downside move from April’s low of 160.32 against the US Dollar, where investors suspect that the Japanese officials intervened. Investors suspected a probable intervention after the BoJ data suggested that it spent nearly 60 billion Yen to prevent further downside. The USD/JPY pair fell to near 151.82 after the suspected stealth intervention.
The 200-period Exponential Moving Average (EMA), which is currently trading near 156.00, acted as a major support for the US Dollar bulls. The cushion near the 200-EMA suggested that a positive long-term outlook is intact.
The 14-period Relative Strength Index (RSI) hovers near 60.00. A decisive break above this level will trigger the upside momentum.
Japanese Yen FAQs
The Japanese Yen (JPY) is one of the world’s most traded currencies. Its value is broadly determined by the performance of the Japanese economy, but more specifically by the Bank of Japan’s policy, the differential between Japanese and US bond yields, or risk sentiment among traders, among other factors.
One of the Bank of Japan’s mandates is currency control, so its moves are key for the Yen. The BoJ has directly intervened in currency markets sometimes, generally to lower the value of the Yen, although it refrains from doing it often due to political concerns of its main trading partners. The current BoJ ultra-loose monetary policy, based on massive stimulus to the economy, has caused the Yen to depreciate against its main currency peers. This process has exacerbated more recently due to an increasing policy divergence between the Bank of Japan and other main central banks, which have opted to increase interest rates sharply to fight decades-high levels of inflation.
The BoJ’s stance of sticking to ultra-loose monetary policy has led to a widening policy divergence with other central banks, particularly with the US Federal Reserve. This supports a widening of the differential between the 10-year US and Japanese bonds, which favors the US Dollar against the Japanese Yen.
The Japanese Yen is often seen as a safe-haven investment. This means that in times of market stress, investors are more likely to put their money in the Japanese currency due to its supposed reliability and stability. Turbulent times are likely to strengthen the Yen’s value against other currencies seen as more risky to invest in.
Recommended Articles


