AUD/JPY Price Analysis: Faces resistance at Tenkan-Sen, as buyers eye 103.00

Source Fxstreet
  • AUD/JPY up 0.30%, showing bullish momentum for potential rise beyond 102.35.
  • Bullish RSI indicates room for growth before hitting overbought conditions.
  • Key levels: Resistance at Tenkan-Sen (102.42) and support at Kijun-Sen (101.36).

The AUD/JPY extends its gains for the fifth day in a row, climbs 0.30%, and trades at 102.35. Market sentiment remains upbeat, which usually weighs on the Japanese Yen (JPY) safe-haven appeal, which remains the laggard in the Forex markets against other peers.

AUD/JPY Price Analysis: Technical outlook

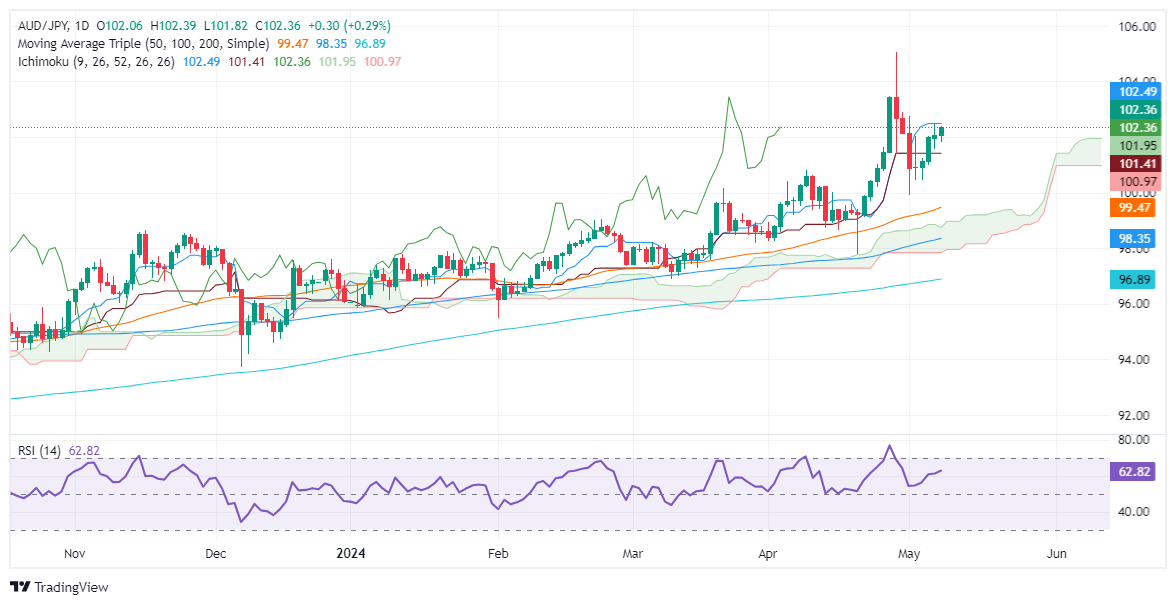
After reaching a year-to-date (YTD) high at 104.95, the AUD/JPY retreated towards 100.00, following a confirmed intervention by the Bank of Japan (BoJ). Since then, the pair has extended its gains, though it faces solid resistance at the Tenkan-Sen at 102.42.

Momentum favors buyers, with the Relative Strength Index (RSI) standing at bullish territory, aiming upwards with enough room before hitting overbought territory.

If AUD/JPY buyers want to re-test the YTD high, they must clear the Tenkan-Sen. Once surpassed, the 103.00 figure would emerge as the next stop, ahead of testing April’s 26 high at 103.47. Up next would be 104.00, followed by the YTD high.

On the other hand, buyers' failure to crack the Tenkan-Sen can pave the way for sellers to step in and push prices lower. The first support would be the 102.00 mark, followed by the Kijun-Sen at 101.36. Further losses are seen at the May 3 low at 100.45, followed by the 100.00 figure.

AUD/JPY Price Action – Daily Chart

AUD/JPY

Overview
Today last price 102.36
Today Daily Change 0.30
Today Daily Change % 0.29
Today daily open 102.06
 
Trends
Daily SMA20 100.66
Daily SMA50 99.38
Daily SMA100 98.29
Daily SMA200 96.85
 
Levels
Previous Daily High 102.47
Previous Daily Low 101.58
Previous Weekly High 105.04
Previous Weekly Low 99.93
Previous Monthly High 105.04
Previous Monthly Low 97.78
Daily Fibonacci 38.2% 102.13
Daily Fibonacci 61.8% 101.92
Daily Pivot Point S1 101.61
Daily Pivot Point S2 101.15
Daily Pivot Point S3 100.72
Daily Pivot Point R1 102.49
Daily Pivot Point R2 102.92
Daily Pivot Point R3 103.38


Disclaimer: For information purposes only. Past performance is not indicative of future results.
placeholder
US May CPI Preview: Rising Inflation May Push Up Fed Rate Hike Expectations, How Will US Stocks, Dollar, Gold React? The U.S. Bureau of Labor Statistics will release May CPI data at 8:30 AM ET on June 10. This report is the most critical inflation reading ahead of the Federal Reserve's policy meeting on
Author  TradingKey
10 hours ago
The U.S. Bureau of Labor Statistics will release May CPI data at 8:30 AM ET on June 10. This report is the most critical inflation reading ahead of the Federal Reserve's policy meeting on
placeholder
WTI Crude Oil Falls to $90 Level. Iran Situation Cools Suddenly, Strait of Hormuz June Opening Seen Unlikely On June 8, tensions in the Iran conflict cooled abruptly, and both major crude oil futures fell. WTI crude futures briefly retreated to around the $90 level. As of press time, it was up 0
Author  TradingKey
13 hours ago
On June 8, tensions in the Iran conflict cooled abruptly, and both major crude oil futures fell. WTI crude futures briefly retreated to around the $90 level. As of press time, it was up 0
placeholder
WTI edges lower to near $89.50 as Iran, Israel agree to halt attacksWest Texas Intermediate (WTI) oil price edges lower after registering over 1% losses in the previous day, trading around $89.40 per barrel during the Asian hours on Tuesday.
Author  FXStreet
18 hours ago
West Texas Intermediate (WTI) oil price edges lower after registering over 1% losses in the previous day, trading around $89.40 per barrel during the Asian hours on Tuesday.
placeholder
Gold Drops Below $4,300 Erasing Year-to-Date Gains. This Week’s CPI May Ignite Rate Hike Expectations Will Gold Still Rise in 2026?During Monday's Asian session, both spot and futures gold prices fell below the $4,300/oz support level. Spot gold touched an intraday low of $4,268.42, its lowest level since March 23, e
Author  TradingKey
Yesterday 09: 58
During Monday's Asian session, both spot and futures gold prices fell below the $4,300/oz support level. Spot gold touched an intraday low of $4,268.42, its lowest level since March 23, e
placeholder
Bitcoin Supply In Loss Crosses Critical Threshold — Bullish Reversal Next?After days of steep downward movement, the price of Bitcoin appears to have found a somewhat reliable anchor around the $60,000 region. However, recent on-chain data suggests that the premier
Author  NewsBTC
Yesterday 01: 16
After days of steep downward movement, the price of Bitcoin appears to have found a somewhat reliable anchor around the $60,000 region. However, recent on-chain data suggests that the premier
Related Instrument
goTop
quote