USD/SEK rises after Riksbank's cut and dovish outlook

Source Fxstreet
  • USD/SEK maintains gains exceeding 0.40%, underscoring the Dollar's continued firmness during Wednesday's session.
  • The Riksbank sports a dovish view, trimming rates as forecasted, coupled with indications of more rate cuts in the second half of this year.
  • Fed hawks are stepping in and challenging the dovish narrative.

The USD/SEK pair is trading higher at 10.55, marking a significant gain from a low of 10.45 last week. This uptick comes on the back of the monetary policy divergences between the Federal Reserve (Fed) and Riksbank. On the one hand, the Fed’s officials are turning hawkish. On the other hand, Riksbank, with a more dovish stance, has started to cut rate cuts and may undertake additional reductions in the second half of the year if the present economic conditions prevail.

After cutting rates to 3.75%, Governor Thedeen expressed a sense of caution, suggesting that a rate cut in June is improbable given the existing circumstances. He emphasized the concern regarding the weakening of the Swedish Krona (SEK), indicating that it needs to be taken into account. As for now, market expectations anticipate a total of 75 basis points of rate cuts over the next 12 months.

On the US side, recent dovish bets have been given up by investors, and the start of the easing cycle of the Fed is being priced in to start in November.

USD/SEK technical analysis

On the daily chart, the Relative Strength Index (RSI) for the USD/SEK pair resides within the positive territory after recovering from a dip into the negative domain. The MACD histogram sheds more light on the scenario, with progressively decreasing red bars showcasing a slowdown in negative momentum.

USD/SEK daily chart

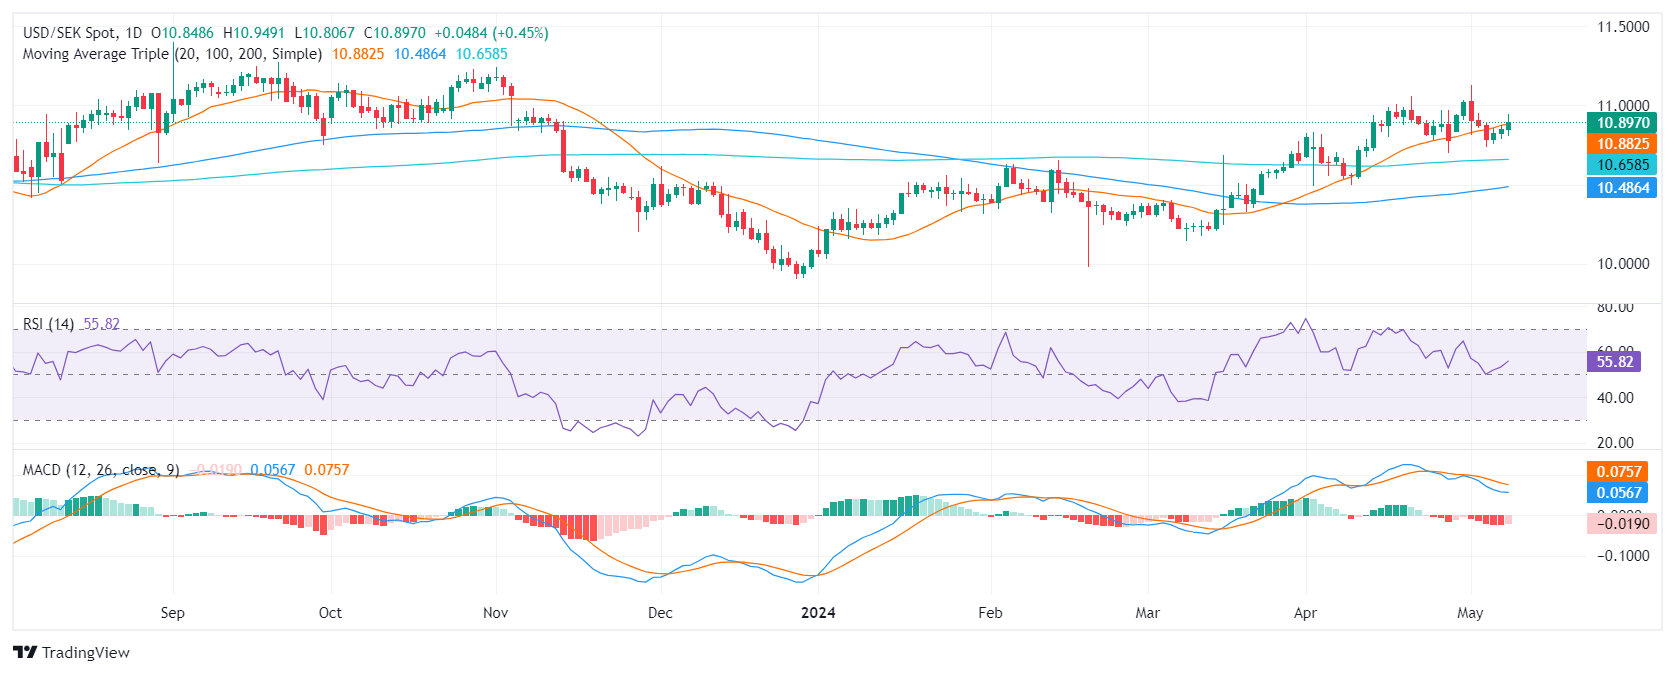
In regard to the Simple Moving Averages (SMAs), the USD/SEK pair has reclaimed territory above the pivotal 20-day SMA. This escape from the bears not only illustrates evidence of buyers stepping in to restore short-term sentiment but also signals a potential shift in momentum. When observing the larger picture, the pair maintains a position above the 100 and 200-day SMAs, illustrating a solid long-term trend in favor of the bulls.

USD/SEK

Overview
Today last price 10.9054
Today Daily Change 0.0568
Today Daily Change % 0.52
Today daily open 10.8486
 
Trends
Daily SMA20 10.8735
Daily SMA50 10.6278
Daily SMA100 10.4794
Daily SMA200 10.6575
 
Levels
Previous Daily High 10.8785
Previous Daily Low 10.7876
Previous Weekly High 11.1318
Previous Weekly Low 10.7346
Previous Monthly High 11.0627
Previous Monthly Low 10.4914
Daily Fibonacci 38.2% 10.8438
Daily Fibonacci 61.8% 10.8223
Daily Pivot Point S1 10.7979
Daily Pivot Point S2 10.7473
Daily Pivot Point S3 10.707
Daily Pivot Point R1 10.8889
Daily Pivot Point R2 10.9292
Daily Pivot Point R3 10.9798


Disclaimer: For information purposes only. Past performance is not indicative of future results.
placeholder
Natural Gas sinks to pivotal level as China’s demand slumpsNatural Gas price (XNG/USD) edges lower and sinks to $2.56 on Monday, extending its losing streak for the fifth day in a row. The move comes on the back of China cutting its Liquified Natural Gas (LNG) imports after prices rose above $3.0 in June. It
Author  FXStreet
Jul 01, 2024
Natural Gas price (XNG/USD) edges lower and sinks to $2.56 on Monday, extending its losing streak for the fifth day in a row. The move comes on the back of China cutting its Liquified Natural Gas (LNG) imports after prices rose above $3.0 in June. It
placeholder
Bitcoin Price Flashes Fractal Similar To October 2023, Here’s What Happened Last TimeCrypto analyst TradingShot recently revealed that the Bitcoin price is forming a similar fractal pattern to the one that happened in October 2023. This is bullish for the flagship crypto, considering what happened last year when the fractal pattern formed.
Author  NewsBTC
Oct 11, 2024
Crypto analyst TradingShot recently revealed that the Bitcoin price is forming a similar fractal pattern to the one that happened in October 2023. This is bullish for the flagship crypto, considering what happened last year when the fractal pattern formed.
placeholder
Bitcoin Price Forecast: BTC extends gains after third consecutive week of ETF inflowsBitcoin (BTC) extends gains, trading above $73,000 at the time of writing on Monday, following a bullish breakout from the consolidation pattern it had been trading since roughly the past six weeks.
Author  FXStreet
Mar 16, Mon
Bitcoin (BTC) extends gains, trading above $73,000 at the time of writing on Monday, following a bullish breakout from the consolidation pattern it had been trading since roughly the past six weeks.
placeholder
Gold rises on Middle East tensions; inflation fears temper rate cut bets and cap gainsGold (XAU/USD) edges higher during the Asian session on Tuesday, though it lacks follow-through and remains close to an over three-week low, touched the previous day.
Author  FXStreet
Yesterday 05: 50
Gold (XAU/USD) edges higher during the Asian session on Tuesday, though it lacks follow-through and remains close to an over three-week low, touched the previous day.
placeholder
Silver Price Forecast: XAG/USD consolidates above $79.00; bearish bias intact ahead of FedSilver (XAG/USD) lacks a firm intraday direction and oscillates in a narrow range during the Asian session on Wednesday as traders opt to wait on the sidelines ahead of the crucial FOMC rate decision.
Author  FXStreet
9 hours ago
Silver (XAG/USD) lacks a firm intraday direction and oscillates in a narrow range during the Asian session on Wednesday as traders opt to wait on the sidelines ahead of the crucial FOMC rate decision.
Related Instrument
goTop
quote