EUR/GBP Price Analysis: Bounces off range low

Source Fxstreet
  • EUR/GBP price has fallen to the floor of a multi-month range and rebounded off support. 
  • It is now poised to begin rising back up inside the channel continuing the sideways trend. 
  • The MACD indicator is poised to cross its signal line giving a buy signal, reinforcing the new up move. 

EUR/GBP price has fallen to 0.8530, one pip above the base of a multi-month range at 0.8530. 

The pair has bounced off the support from the range low and is trading back up at 0.8547 at the time of publication.

EUR/GBP 4-hour Chart 


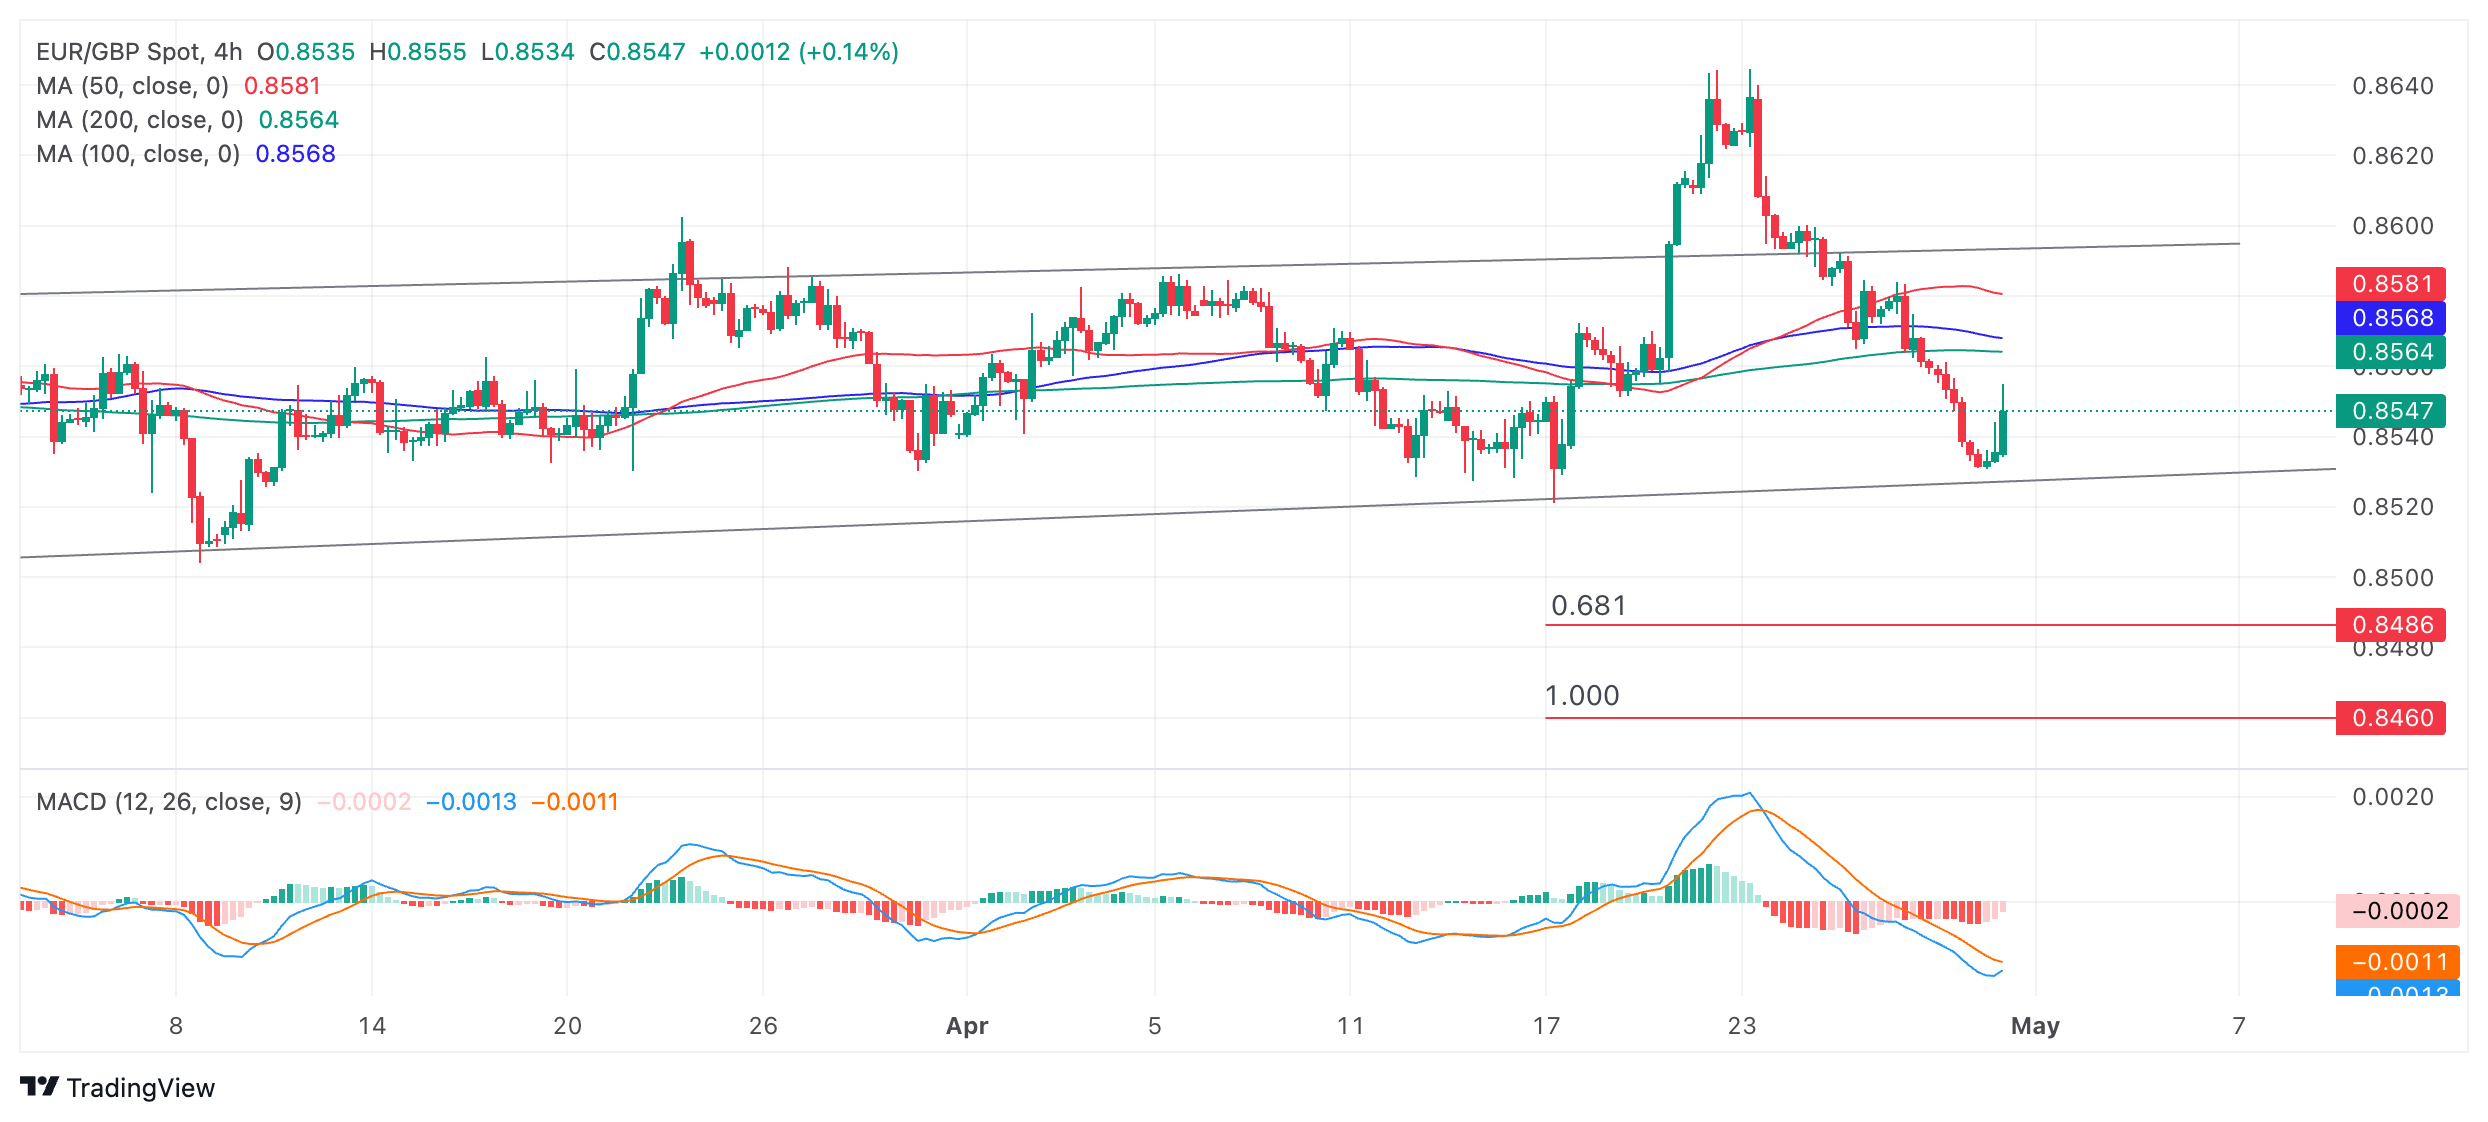
EUR/GBP is in a sideways trend which is forecast to continue until a directional bias proves otherwise. It will now probably start rising back up inside the range towards resistance from the cluster of Moving Averages in the 0.8560s. If it successfully breaks above them it will probably continue up to the ceiling of the range at roughly 0.8595. 

The Moving Average Convergence Divergence (MACD) indicator looks like it is poised to cross above its signal line. If it does it will give a buy signal and suggest more upside increasing the probability of a rally within the range. The signal would be improved by the fact the pair is in a sideways trend and MACD is proven to be a more reliable indicator in non-trending markets. 

A decisive break below the range low would open the way for more downside to the next target at 0.8486. This is the 0.681 Fibonacci ratio of the height of the range extrapolated lower from the channel’s base. This is the method used by technical analysts to estimate range breakouts. Further weakness could even see price reach the next target at 0.8460, the full height of the range extrapolated lower (1.000). 

A decisive break would be one characterized by a long red candlestick that broke completely below the range floor and closed near its low, or three consecutive red candlesticks that broke clearly below the level. 


Disclaimer: For information purposes only. Past performance is not indicative of future results.
placeholder
BTC Hovers Near 60,000 Mark After Plunge. US May CPI Set to Be Revealed, How Is Wall Street Betting?Bitcoin's rebound falters as the U.S.-Iran conflict and CPI data likely sustain downward pressure.On June 10, escalating U.S.-Iran tensions put the already fragile crypto market to the te
Author  TradingKey
7 hours ago
Bitcoin's rebound falters as the U.S.-Iran conflict and CPI data likely sustain downward pressure.On June 10, escalating U.S.-Iran tensions put the already fragile crypto market to the te
placeholder
Gold plummets below $4,200 as US‑Iran tensions spur hawkish rate bets ahead of US CPIGold (XAU/USD) extends the recent breakdown momentum below a technically significant 200-day Simple Moving Average (SMA) and drops to a fresh low since March 23, further below the $4,200 mark during the Asian session on Wednesday.
Author  FXStreet
8 hours ago
Gold (XAU/USD) extends the recent breakdown momentum below a technically significant 200-day Simple Moving Average (SMA) and drops to a fresh low since March 23, further below the $4,200 mark during the Asian session on Wednesday.
placeholder
Gold Prices Fall for Four Consecutive Months, Has the Precious Metals Bull Market Partially Ended? Where Is the Next Support Level?Gold Prices ( XAUUSD) Slump for Four Consecutive Months: Has the Precious Metals Bull Market Partially Ended? Where Is the Next Support Level?Year-to-date, international gold prices have
Author  TradingKey
9 hours ago
Gold Prices ( XAUUSD) Slump for Four Consecutive Months: Has the Precious Metals Bull Market Partially Ended? Where Is the Next Support Level?Year-to-date, international gold prices have
placeholder
WTI steadies around $87.50 despite renewed supply concernsWest Texas Intermediate (WTI) oil price experiences volatility after registering over 2.5% losses in the previous day, trading around $87.40 per barrel during the Asian hours on Wednesday.
Author  FXStreet
15 hours ago
West Texas Intermediate (WTI) oil price experiences volatility after registering over 2.5% losses in the previous day, trading around $87.40 per barrel during the Asian hours on Wednesday.
placeholder
US May CPI Preview: Rising Inflation May Push Up Fed Rate Hike Expectations, How Will US Stocks, Dollar, Gold React? The U.S. Bureau of Labor Statistics will release May CPI data at 8:30 AM ET on June 10. This report is the most critical inflation reading ahead of the Federal Reserve's policy meeting on
Author  TradingKey
Yesterday 09: 55
The U.S. Bureau of Labor Statistics will release May CPI data at 8:30 AM ET on June 10. This report is the most critical inflation reading ahead of the Federal Reserve's policy meeting on
Related Instrument
goTop
quote