

USD/JPY holds near 155.50 after Tokyo CPI inflation eases more than expected
- Japan’s Tokyo CPI inflation fell below forecasts early Friday.
- US data confounded rate-hungry investors on Thursday.
- Markets await BoJ rate call, US PCE Price Index figures.
Japan’s Tokyo Consumer Price Inflation (CPI) inflation printed well below expectations early Friday, which will complicate the Bank of Japan’s (BoJ) upcoming rate call and Monetary Policy Report, due during the Pacific market session.
Tokyo CPI inflation rose only 1.8% on an annualized basis in April, well below the previous print of 2.6%. Markets were broadly expecting Tokyo inflation to hold steady over the period.
Read more: Tokyo Consumer Price Index rises 1.8% YoY in April vs. 2.6% expected
US Gross Domestic Product (GDP) also eased faster than expected, prompting discouragement in risk appetite on Thursday. Further complicating matters, US Personal Consumption Expenditure (PCE) inflation remained stubbornly higher in the first quarter than investors hoping for Federal Reserve (Fed) rate cuts were hoping for.
US PCE Price Index inflation will deliver a fine-tuned look at US inflation later Friday. US MoM Core PCE Price Index numbers for March are forecast to hold steady at 0.3%.
With the Japanese Yen (JPY) trading into multi-year lows across the board, the BoJ is expected to begin weighing market interventions. According to reporting by Nikkei, the Japanese central bank is expected to discuss intervention options to help bolster the battered Yen.
USD/JPY technical outlook
USD/JPY is trading tightly just below the 156.00 handle, hugging multi-year highs as the Yen continues to deflate. The pair is trading into 30-plus year highs, and bullish momentum is targeting all-time record bids beyond 160.00, a price level the pair hasn’t reached since 1990.
The USD/JPY pair is on pace to close bullish for a fourth consecutive month, and is up 10.4% in 2024.
USD/JPY hourly chart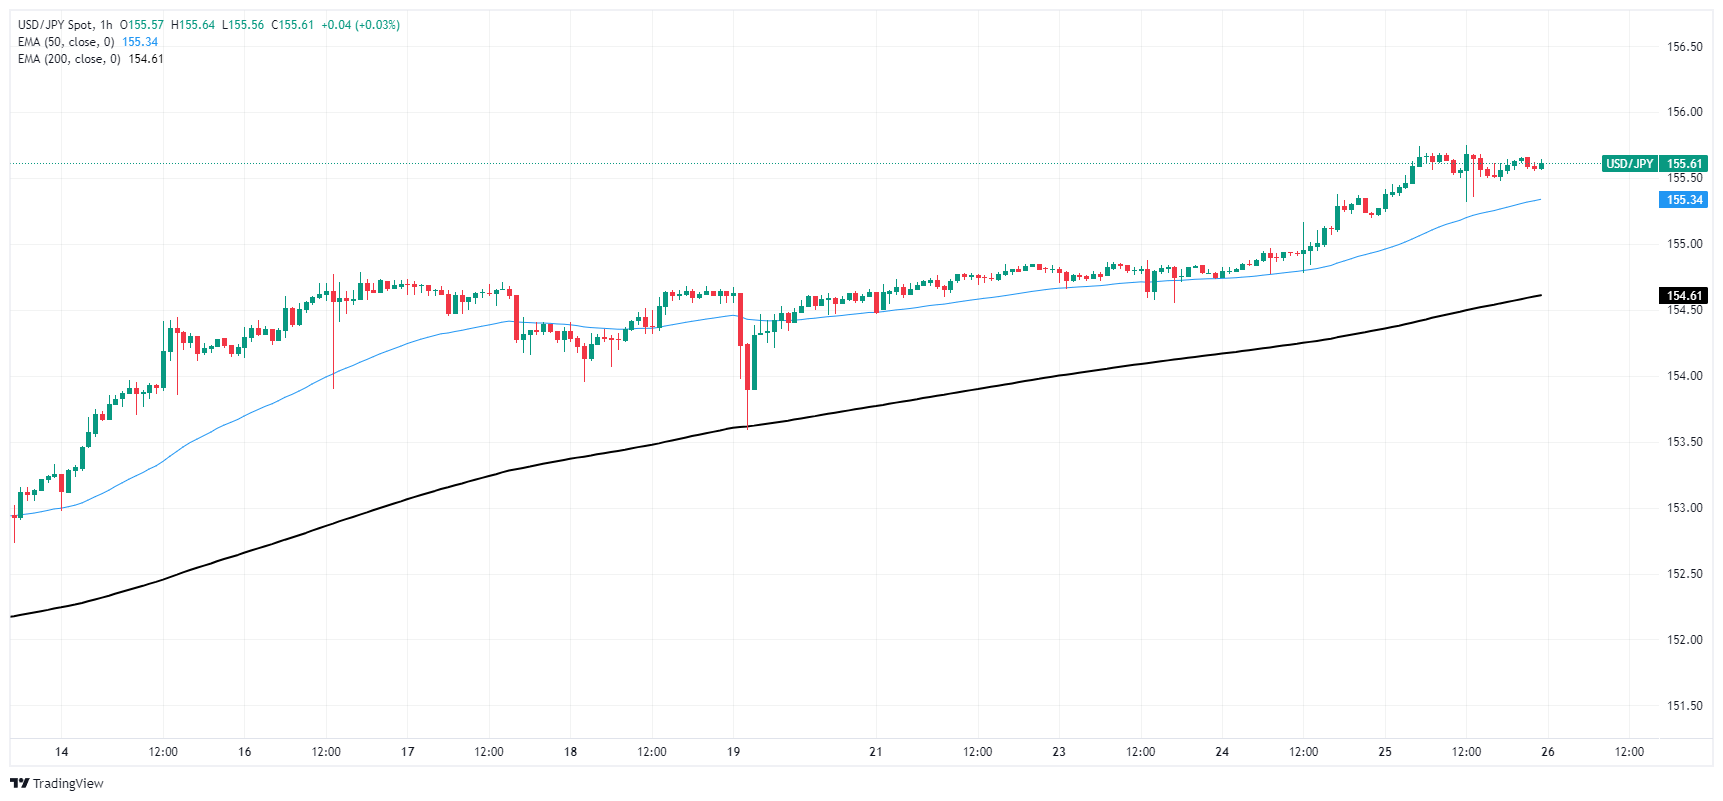
USD/JPY daily chart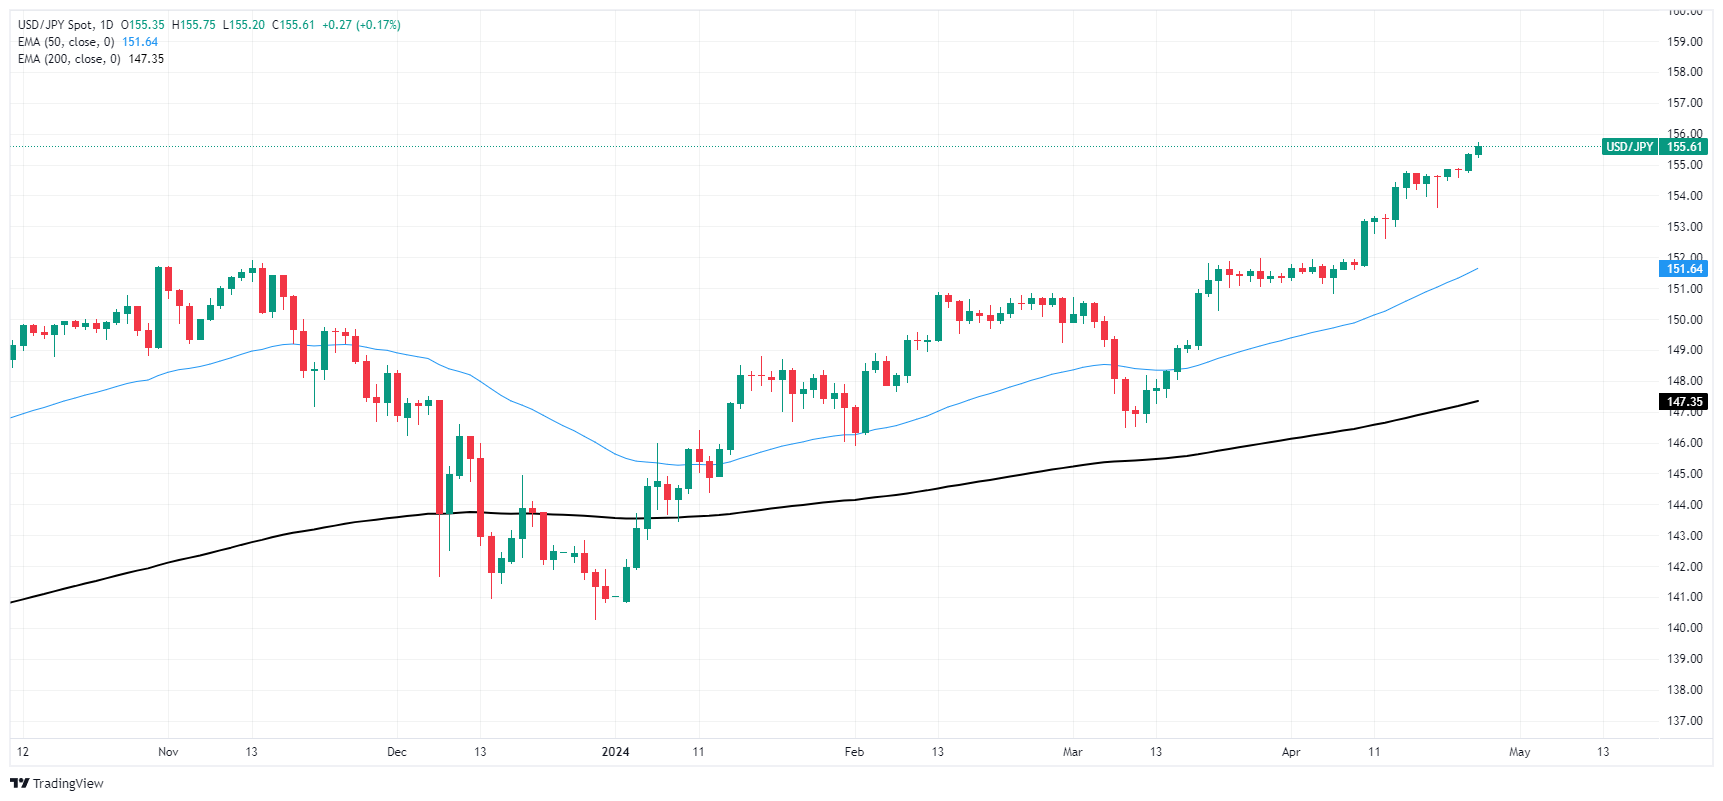
Recommended Articles


