NZD/JPY Price Analysis: Bulls don’t give up and continue climbing, might be time for a correction

Source Fxstreet
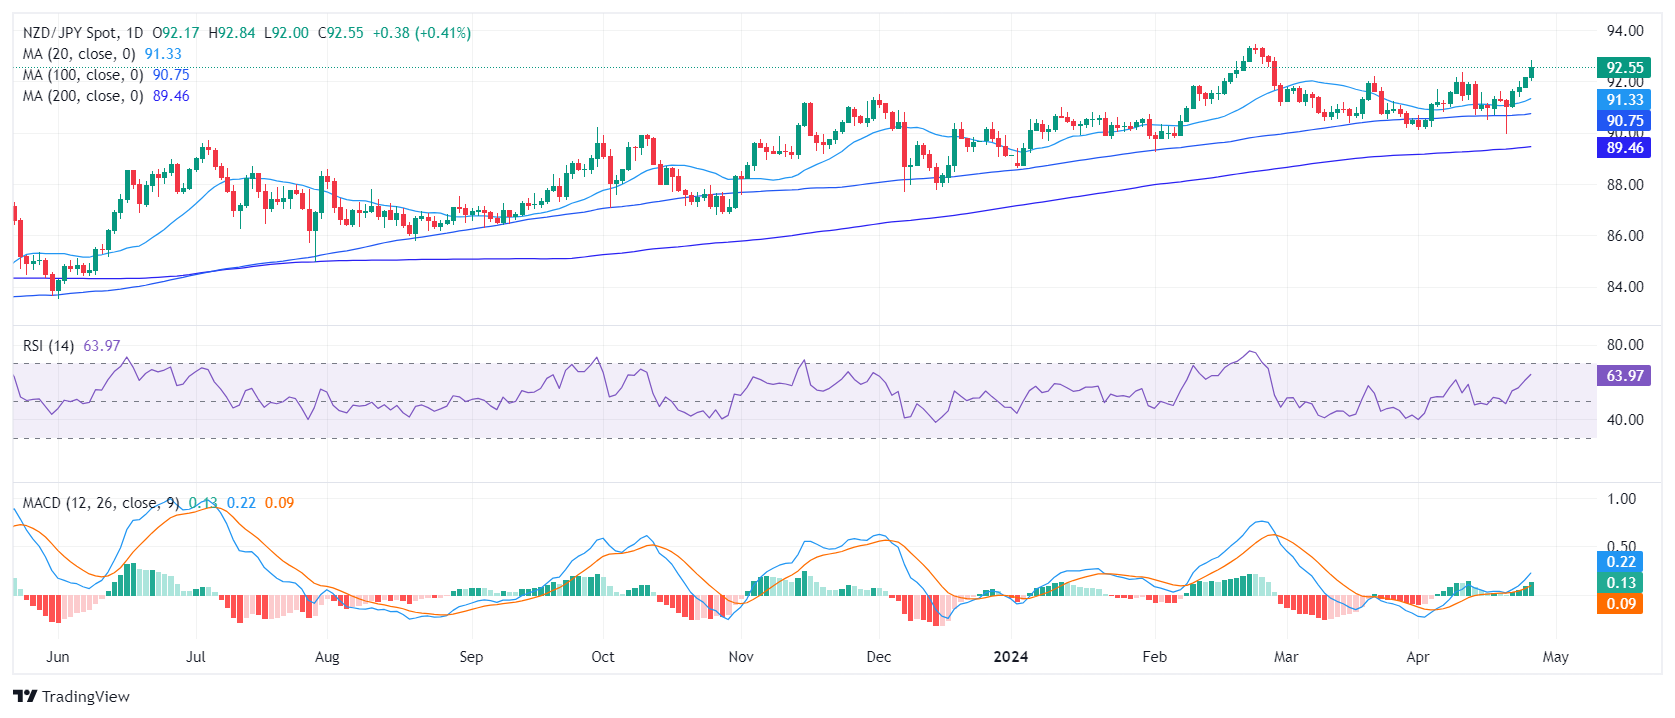
  • The daily RSI shows strong buying momentum for the NZD/JPY, moving deep in positive territory.
  • Parallelly, the daily MACD indicates green bars on a rising tendency, suggesting growing buying traction.
  • A possible market correction may be imminent, as the daily RSI reaches near-overbought conditions.
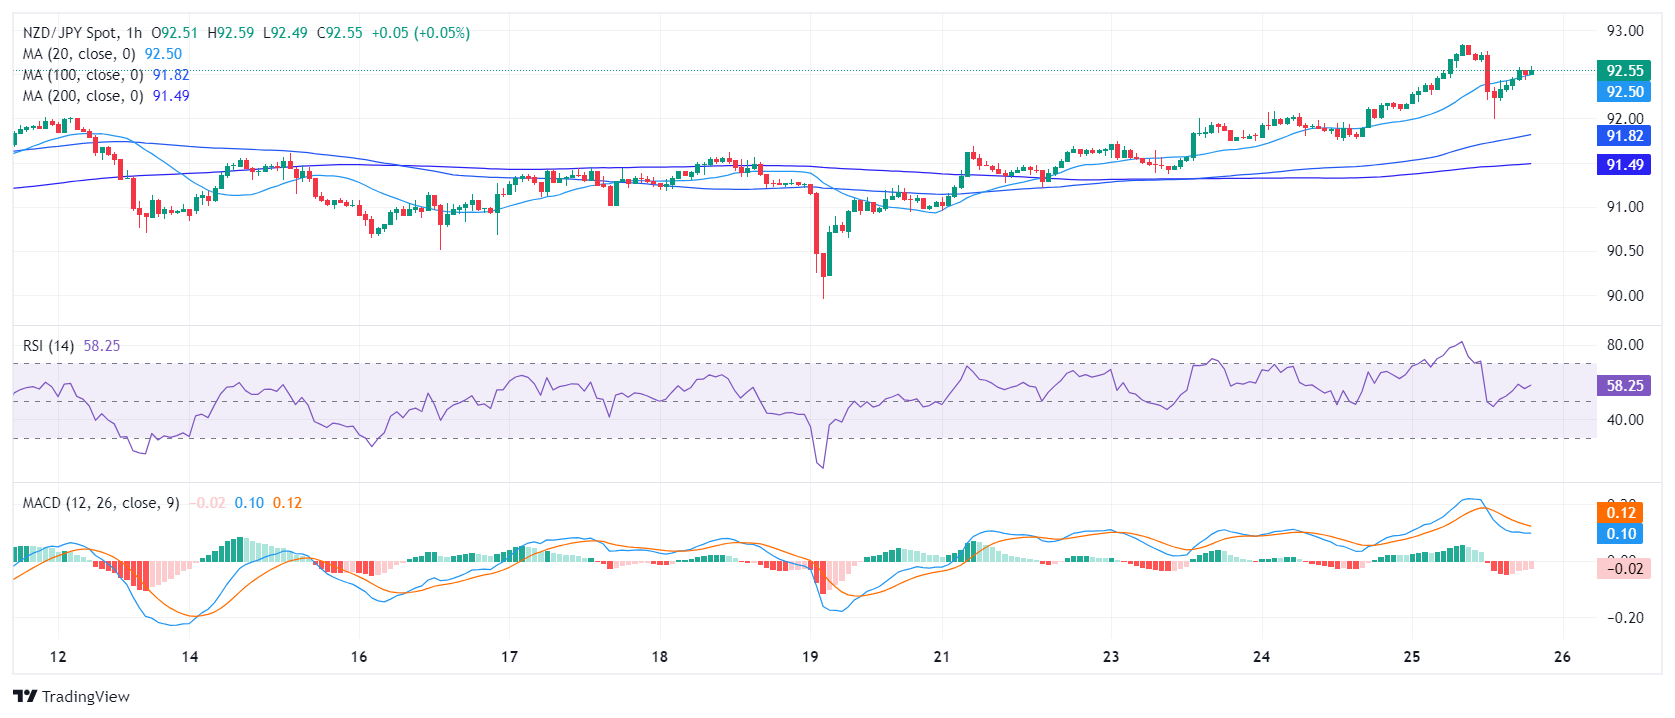
  • A slight decline in the hourly indicators signals a pause in buyers' at least for Thursday’s session.

The NZD/JPY pair has shown a bullish performance, upheld by strong buying momentum over past trading sessions. Although it stands at 92.55, a high since February, signs of a potential market shift are emerging as indicators are near overbought territory.

Based on the daily chart, the Relative Strength Index (RSI) indicates increasing bullish momentum, having moved from a negative territory into positive conditions during the previous session and it resides near the 70 threshold. Concurrently, the Moving Average Convergence Divergence (MACD) shows rising green bars, indicating a developing positive momentum. Nonetheless, the RSI nearing overbought conditions provides a warning about the potential for market correction.

NZD/JPY daily chart
On the hourly chart, the RSI moved steadily upwards from a negative to a positive trend. However, recent RSI levels are slightly lower as they seem to be correcting overbought conditions noted earlier in the session.

NZD/JPY hourly chart
In a broader context, the placement of the NZD/JPY relative to its Simple Moving Average (SMA), the cross pair is trading above its 20, 100, and 200-day SMA, suggestive of an upward trajectory. This positioning supports both short-term buy opportunities and a favorable long-term outlook, affirming a sustained long-term bullishness for the NZD/JPY.

NZD/JPY

Overview
Today last price 92.56
Today Daily Change 0.39
Today Daily Change % 0.42
Today daily open 92.17
 
Trends
Daily SMA20 91.22
Daily SMA50 91.45
Daily SMA100 90.71
Daily SMA200 89.43
 
Levels
Previous Daily High 92.18
Previous Daily Low 91.74
Previous Weekly High 91.62
Previous Weekly Low 89.96
Previous Monthly High 92.2
Previous Monthly Low 90.17
Daily Fibonacci 38.2% 92.01
Daily Fibonacci 61.8% 91.91
Daily Pivot Point S1 91.88
Daily Pivot Point S2 91.59
Daily Pivot Point S3 91.44
Daily Pivot Point R1 92.32
Daily Pivot Point R2 92.47
Daily Pivot Point R3 92.76


Disclaimer: For information purposes only. Past performance is not indicative of future results.
placeholder
U.S. Q3 Earnings Season Nears Close as Investors Eye Dell, HP Results.U.S. October PCE Price Index Released【The week ahead】TradingKey - Last week, concerns over an AI bubble, coupled with fading expectations for Federal Reserve rate cuts, triggered a broad sell-off in U.S. equities. The tech-heavy Nasdaq Composite (.IXIC.
Author  TradingKey
8 hours ago
TradingKey - Last week, concerns over an AI bubble, coupled with fading expectations for Federal Reserve rate cuts, triggered a broad sell-off in U.S. equities. The tech-heavy Nasdaq Composite (.IXIC.
placeholder
Top 3 Price Prediction: Bitcoin, Ethereum, Ripple – BTC, ETH and XRP Attempt Recovery Post-SelloffBitcoin trades back above $87,700 after a 20% drop, while Ethereum rebounds from support around $2,749 and XRP recovers above $2.08 off its $1.96 floor, as BTC, ETH and XRP all try to turn last week’s steep correction into the start of a broader recovery.
Author  Mitrade
13 hours ago
Bitcoin trades back above $87,700 after a 20% drop, while Ethereum rebounds from support around $2,749 and XRP recovers above $2.08 off its $1.96 floor, as BTC, ETH and XRP all try to turn last week’s steep correction into the start of a broader recovery.
placeholder
2025 Black Friday is coming! Which stocks may see volatility?Coming on the day right after Thanksgiving in the United States, Back Friday marks the start of the holiday shopping season. Sales data from this shopping frenzy day reflects investor confidence and consumer trends. The National Retail Federation (NRF) predicts that holiday season (Nov and Dec) retail sales in 2025 will likely exceed $1 trillion for the very first time, which represents a year-over-year increase of 3.7 to 4.2 percent. Historic data from the past decade show that the retail sector has generally outperformed the S&P 500 during the weeks before and after Black Friday. The following retailing companies are expected to be big winners:
Author  Insights
13 hours ago
Coming on the day right after Thanksgiving in the United States, Back Friday marks the start of the holiday shopping season. Sales data from this shopping frenzy day reflects investor confidence and consumer trends. The National Retail Federation (NRF) predicts that holiday season (Nov and Dec) retail sales in 2025 will likely exceed $1 trillion for the very first time, which represents a year-over-year increase of 3.7 to 4.2 percent. Historic data from the past decade show that the retail sector has generally outperformed the S&P 500 during the weeks before and after Black Friday. The following retailing companies are expected to be big winners:
placeholder
Bitcoin Volatility Spikes: Is Options-Driven Pricing Making a Comeback?Bitcoin's volatility is surging, suggesting a shift back to options-driven price action seen before Bitcoin ETFs were launched.
Author  Mitrade
15 hours ago
Bitcoin's volatility is surging, suggesting a shift back to options-driven price action seen before Bitcoin ETFs were launched.
placeholder
USD/JPY gathers strength to near 156.50 on mixed Fed signals The USD/JPY pair posts modest gains near 156.50 during the early Asian session on Monday. Less dovish Federal Reserve (Fed) expectations could provide some support to the US Dollar (USD) against the Japanese Yen (JPY).
Author  FXStreet
17 hours ago
The USD/JPY pair posts modest gains near 156.50 during the early Asian session on Monday. Less dovish Federal Reserve (Fed) expectations could provide some support to the US Dollar (USD) against the Japanese Yen (JPY).
goTop
quote