

GBP/JPY churns but finds higher ground near 195.00

Source Fxstreet
  • GBP/JPY inches into multi-year highs as Yen softens further.
  • Odds are increasing of BoJ verbal intervention spilling over into actual intervention.
  • Tokyo CPI inflation, BoJ rate call approach on Friday.

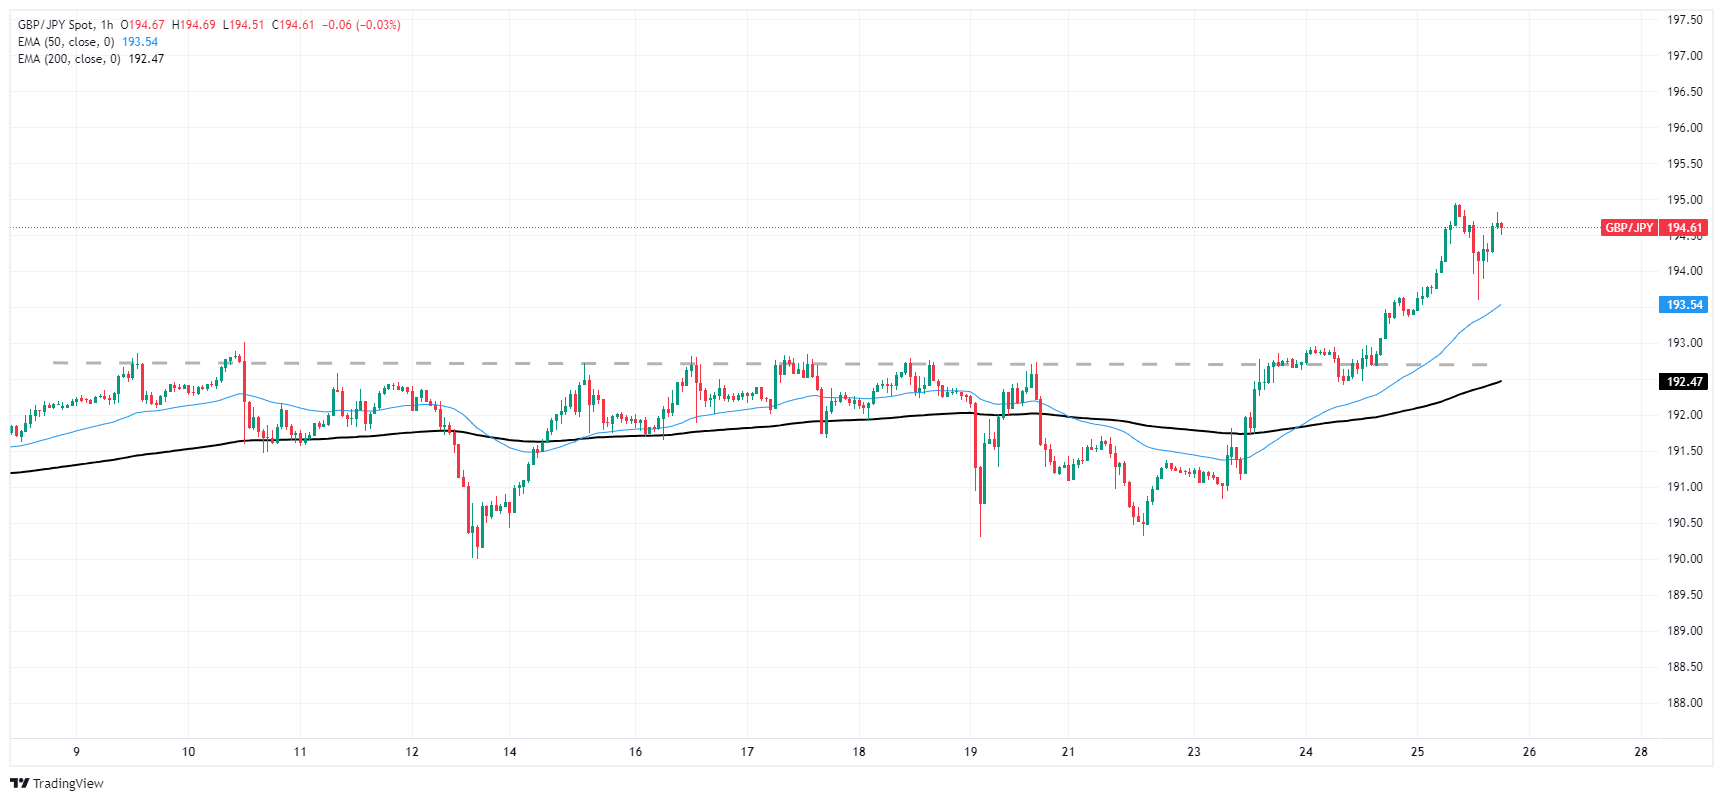
The GBP/JPY pushed into fresh multi-year highs on Thursday as the pair grinds towards the 195.00 handle. The Japanese Yen (JPY) continues to weaken across the broader FX market, prompting increasing rhetoric from the Bank of Japan (BoJ) regarding direct intervention in currency markets to shore up the beleaguered JPY. The BoJ is expected to discuss intervention on the Yen’s behalf at their latest policy meeting, slated for Friday.

Japan’s Tokyo Consumer Price Index (CPI) inflation will be printing early Friday, and markets expect Japan’s leading inflation indicator to hold steady at 2.6% for the year ended in April. Core-core Tokyo CPI inflation (headline inflation less volatile food and energy prices) is expected to tick down slightly to 2.7% over the same period from the previous 2.9%.

The BoJ’s latest Interest Rate Decision and Monetary Policy Statement are also expected early Friday, where markets will look out for signals of FXC intervention from the BoJ. Markets will also look for any announced changes to the BoJ’s bond-buying program.

A press conference headed by BoJ Governor Kazuo Ueda is expected following the BoJ’s latest rate call.

GBP/JPY technical outlook

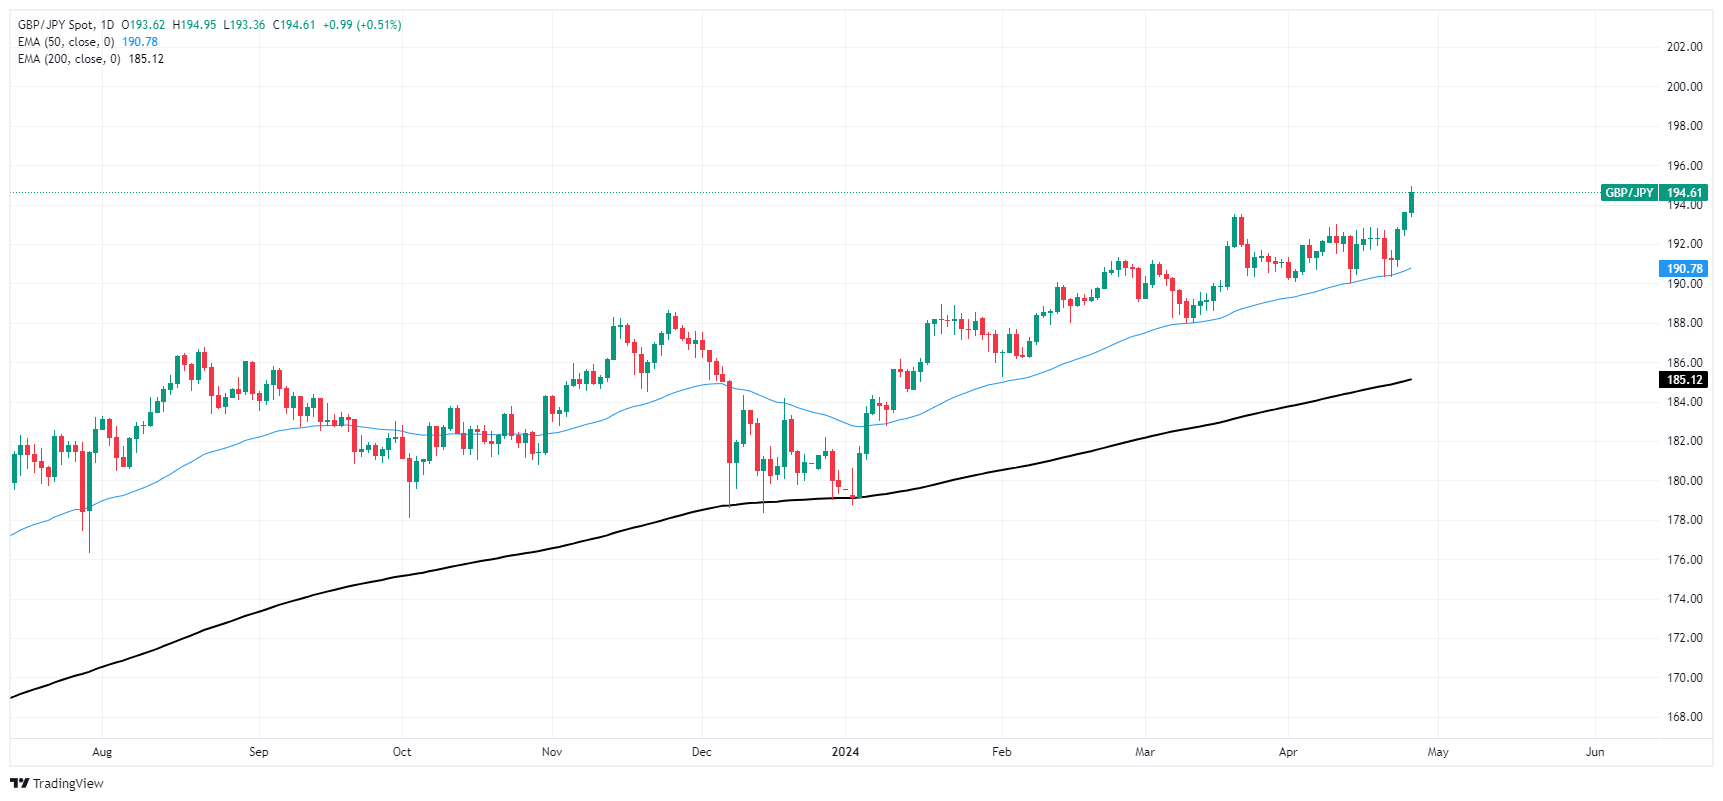
The Guppy has accelerated out of a recent technical range to approach the 195.00 handle, and the pair knocked into a fresh multi-year high. Further bullish momentum will carry the GBP/JPY into record highs, while downside pullbacks will look for a technical floor at 192.70.

The GBP/JPY is set to close for a third straight green day, and daily candles continue to hold well above the 200-day Exponential Moving Average (EMA) at 185.08.

GBP/JPY hourly chart
GBP/JPY daily chart
Disclaimer: For information purposes only. Past performance is not indicative of future results.
placeholder
Anthropic files for a $2 trillion IPO — the $80.7 billion loss is the decoy, the $450 billion compute bill is the riskAnthropic publicly filed its S-1 on October 26, revealing $16.29 billion of first-half revenue (+1,304% year over year) and a $80.7 billion net loss — of which $72.4 billion is a non-cash convertible-note charge. The real number is the $450 billion of signed, mostly non-cancelable compute commitments. Here is what the filing says, why NVDA, ARM and MU are the tradeable read-through, and the conditions that decide whether the AI trade passes its first public valuation test.
Author  Irene Q.
Oct 27, Tue
Anthropic publicly filed its S-1 on October 26, revealing $16.29 billion of first-half revenue (+1,304% year over year) and a $80.7 billion net loss — of which $72.4 billion is a non-cash convertible-note charge. The real number is the $450 billion of signed, mostly non-cancelable compute commitments. Here is what the filing says, why NVDA, ARM and MU are the tradeable read-through, and the conditions that decide whether the AI trade passes its first public valuation test.
placeholder
Brent's $115 front month sits $4.6 above January — the $14 spread to WTI is the supply-risk premiumDecember Brent trades at $115.29 while January is $110.71, a $4.58 backwardation. The December Brent-WTI spread is $14.2, versus a $3-5 normal. That gap, not the headline, is where the Middle East supply risk is priced. Here is what the curve says, why the December contract's expiry on October 30 will mechanically cut the headline by $4.6, and the 108.81 neckline that decides the next move.
Author  Irene Q.
Oct 28, Wed
December Brent trades at $115.29 while January is $110.71, a $4.58 backwardation. The December Brent-WTI spread is $14.2, versus a $3-5 normal. That gap, not the headline, is where the Middle East supply risk is priced. Here is what the curve says, why the December contract's expiry on October 30 will mechanically cut the headline by $4.6, and the 108.81 neckline that decides the next move.
placeholder
Gold Price Analysis Today | Forex Gold Analysis | XAU/USD Analysis - October 29, 2026Get the latest gold price analysis, forex gold insights, and XAU/USD analysis for October 29, 2026. Read on for the details.
Author  Mitrade
Oct 29, Thu
Get the latest gold price analysis, forex gold insights, and XAU/USD analysis for October 29, 2026. Read on for the details.
placeholder
Gold Price Analysis Today | Forex Gold Analysis | XAU/USD Analysis - October 30, 2026Get the latest gold price analysis, forex gold insights, and XAU/USD analysis for October 30, 2026. Read on for the details.
Author  Mitrade
Oct 30, Fri
Get the latest gold price analysis, forex gold insights, and XAU/USD analysis for October 30, 2026. Read on for the details.
placeholder
US GDP grew 3.4% and core PCE held at 3.1% — December is now a hike trade, not a cut tradeUS Q3 GDP rose 3.4%, above the 3.1% estimate, while September headline PCE hit 3.6% and core held at 3.1%. December hike odds are near 90%; inventories, AI capex and energy explain why.
Author  Irene Q.
Oct 30, Fri
US Q3 GDP rose 3.4%, above the 3.1% estimate, while September headline PCE hit 3.6% and core held at 3.1%. December hike odds are near 90%; inventories, AI capex and energy explain why.
Related Instrument
goTop
quote