


EUR/USD treks higher as US data underwhelms
- EUR/USD extends its recovery as mixed US data weighs on the US Dollar.
- The US Dollar may also now already have “a lot priced in” according to analysts at Commerzbank.
- The short-term trend could now be bullish on the 4-hour chart.
EUR/USD sherpa-treks higher on Thursday, with a foothold now above 1.0700 as it continues its labored recovery from the 1.0601 April lows. Recent mixed US data has tarnished the image of the US economy, undermining the supremacy of the US Dollar (USD), whilst the Euro (EUR) holds firm on strong services-sector data.
EUR/USD rises as US data mixed
EUR/USD began its recovery on Tuesday after preliminary US PMI data for April showed an unexpected cooling in business activity, suggesting the economy was beginning to feel the burden of higher interest rates.
On Wednesday, the US Census Bureau revealed that Durable Goods Orders in the United States increased 2.6% MoM in March, up from a 0.7% rise previously, and beating estimates of 2.5%. Core goods, which exclude transportation, increased by 0.2% MoM, an improvement over February's 0.1% increase, but short of the 0.3% projected.
Whilst the Durable Goods data was positive, it failed to move USD. This could be because it is viewed as a volatile series or, as some now think, because a lot is already priced into the Dollar, making it less sensitive to positive data.
“A lot is already priced into the Dollar” – Commerzbank
EUR/USD’s recovery may be due to the US Dollar having priced in a lot, in particular the acute shift in market expectations regarding the future course of interest rates, according to Analysts at Commerzbank.
Since the Federal Reserve’s (Fed) March meeting markets have consistently pushed back the date by when the Fed is likely to begin cutting interest rates – higher interest rates attract more foreign capital inflows and are thus positive for the US Dollar.
This recalibration of the future path of interest rates has now been fully priced in, according to Antje Praefcke, FX Analyst at Commerzbank, and in the absence of more catalysts, makes USD more vulnerable to “bad news” than “good news”.
“In my opinion, the market's reaction (USD falling this week) shows that a lot is already priced into the Dollar, such as a soft landing of the economy or a Fed that will only cut the key interest rate much later than previously thought,” says Praefcke.
The US Dollar having “priced in a lot” is why it reacted more to the poor US PMI data on Tuesday than the positive US Durable Goods Order data on Wednesday.
“It is becoming increasingly difficult for the Dollar to benefit from facts and figures that underpin this expectation (a delay in future rate cuts); on the contrary, it tends to react sensitively when the market has doubts about its current expectation in the face of not-so-good data. The Dollar is gradually running out of steam, although it is currently the undisputed most popular currency and is likely to remain so,” adds the Analyst.
EUR/USD rises due to services-sector effect
The Euro (EUR), meanwhile, stabilizes as strong Services PMI data stokes services-sector inflation expectations. This is seen potentially reigning in the European Central Bank (ECB) as it forges ahead with cutting interest rates.
Although a June rate cut is probably still a “fait accomplis”, according to Luis de Guindos, the Vice President of the ECB, his colleague at the ECB, Bundesbank President Joachim Nagel was more cautious on Wednesday.
Nagel said, “Services inflation remains high, driven by continued strong wage growth,” and until inflation fell in a sustainable manner he could not “pre-commit to a particular rate path.”
Technical Analysis: EUR/USD breaks out of short-term range
EUR/USD has broken out of the rectangular range it was trading in on the 4-hour chart by piercing above the ceiling at 1.0700.
It is now less certain EUR/USD is forming a Bear Flag price pattern, which has become deformed by the breakout.
EUR/USD 4-hour Chart
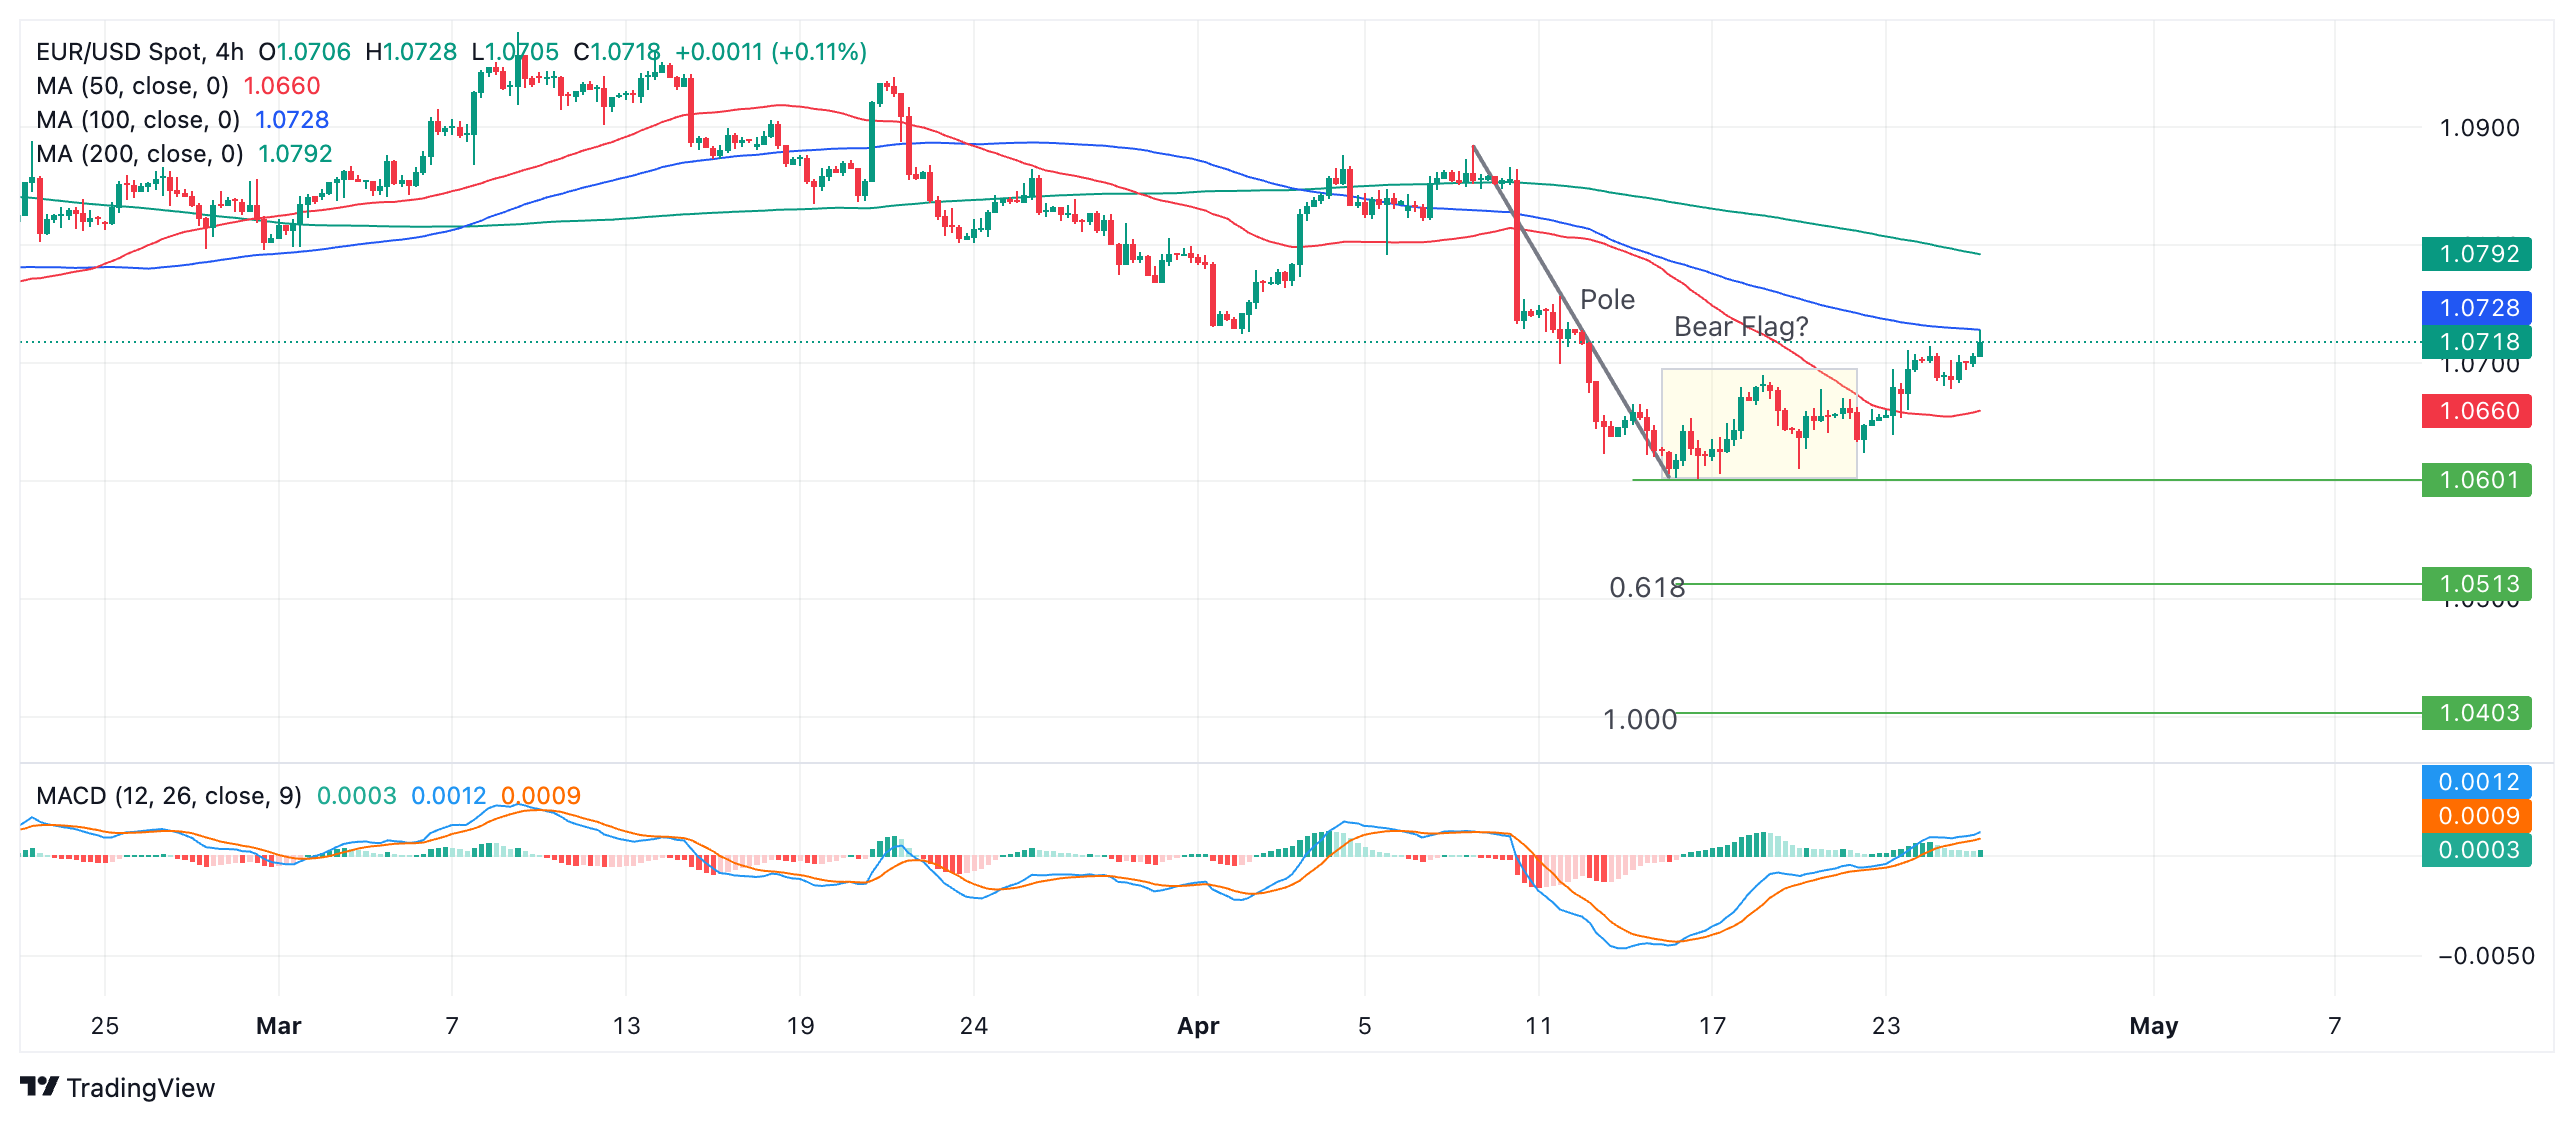
There is an argument for the short-term trend now being bullish and therefore suggestive of more gains in the pair. Resistance from a previous lower high on April 11 gives an initial target at 1.0757. Then the 50-day and 200-day Simple Moving Averages (SMA) on the daily chart (not shown) are likely to resist at 1.0807.
On the other hand a break below the 1.0601 April 16 low would revive the Bear Flag hypothesis.
According to technical lore, the expected move down from a Bear Flag equals the length of the preceding “pole” or a Fibonacci ratio of the pole.
The Fibonacci 0.618 ratio of the pole extrapolated lower gives a conservative target at 1.0503. The next concrete target is at 1.0448 – the October 2023 low. A fall of equal length to the pole would take EUR/USD to 1.0403.
Euro FAQs
The Euro is the currency for the 20 European Union countries that belong to the Eurozone. It is the second most heavily traded currency in the world behind the US Dollar. In 2022, it accounted for 31% of all foreign exchange transactions, with an average daily turnover of over $2.2 trillion a day. EUR/USD is the most heavily traded currency pair in the world, accounting for an estimated 30% off all transactions, followed by EUR/JPY (4%), EUR/GBP (3%) and EUR/AUD (2%).
The European Central Bank (ECB) in Frankfurt, Germany, is the reserve bank for the Eurozone. The ECB sets interest rates and manages monetary policy. The ECB’s primary mandate is to maintain price stability, which means either controlling inflation or stimulating growth. Its primary tool is the raising or lowering of interest rates. Relatively high interest rates – or the expectation of higher rates – will usually benefit the Euro and vice versa. The ECB Governing Council makes monetary policy decisions at meetings held eight times a year. Decisions are made by heads of the Eurozone national banks and six permanent members, including the President of the ECB, Christine Lagarde.
Eurozone inflation data, measured by the Harmonized Index of Consumer Prices (HICP), is an important econometric for the Euro. If inflation rises more than expected, especially if above the ECB’s 2% target, it obliges the ECB to raise interest rates to bring it back under control. Relatively high interest rates compared to its counterparts will usually benefit the Euro, as it makes the region more attractive as a place for global investors to park their money.
Data releases gauge the health of the economy and can impact on the Euro. Indicators such as GDP, Manufacturing and Services PMIs, employment, and consumer sentiment surveys can all influence the direction of the single currency. A strong economy is good for the Euro. Not only does it attract more foreign investment but it may encourage the ECB to put up interest rates, which will directly strengthen the Euro. Otherwise, if economic data is weak, the Euro is likely to fall. Economic data for the four largest economies in the euro area (Germany, France, Italy and Spain) are especially significant, as they account for 75% of the Eurozone’s economy.
Another significant data release for the Euro is the Trade Balance. This indicator measures the difference between what a country earns from its exports and what it spends on imports over a given period. If a country produces highly sought after exports then its currency will gain in value purely from the extra demand created from foreign buyers seeking to purchase these goods. Therefore, a positive net Trade Balance strengthens a currency and vice versa for a negative balance.
Recommended Articles


