

GBP/JPY cracks fresh nine-year high at 193.60
- The Guppy breaks into new chart territory above 193.60, a nine-year high.
- Deflating JPY is rapidly approaching standoff territory with nervous BoJ.
- Japanese inflation figures, BoJ rate call loom ahead on Friday.
The GBP/JPY broke into a fresh nine-year high above 193.60 on Wednesday as the Pound Sterling (GBP) sees recovery bidding and the Japanese Yen (JPY) continues to weaken despite increasingly interventionist rhetoric from the Bank of Japan (BoJ).
According to reporting from Nikkei, the BoJ is set to discuss the “impact of accelerating Yen depreciation”, a clear warning shot that the Japanese central bank could be weighing market operations to bring current Yen moves under heel. The BoJ is slated to deliver its latest Monetary Policy Report and rate call early Friday.
The Pound Sterling is enjoying a reprieve from recent selling pressure after Tuesday’s UK Services Purchasing Managers Index (PMI) recovered significant ground, bounding to 54.9 from the previous 53.1 and vaulting over the forecast downtick to 53.0. The only thing left of note on the economic docket for the UK this week will be Thursday’s GfK Consumer Confidence for April, which is expected to improve, albeit slightly, to -20 from the current -21.
Early Friday will also see the latest print of Japan’s Tokyo Consumer Price Index (CPI) inflation. Tokyo CPI inflation is expected to hold steady at 2.6% for the year ended April, while Core-core Tokyo CPI (headline inflation less volatile food and energy prices) is expected to ease slightly to 2.7% from 2.9% YoY.
GBP/JPY technical outlook
The Guppy broke through a recent technical barrier to squeeze out a fresh nine-year high just above the 193.60 level as the pair continues to price in technical support from the 190.40 region.
GBP/JPY has been trending firmly bullish as the Yen continues to soften. The pair is up around 8% after a bullish bounce from the 200-day Exponential Moving Average near 179.00 at the start of 2024. The 200-day EMA is now breaking through the 185.00 handle as the bullish Guppy runs deeper into bull country.
GBP/JPY hourly chart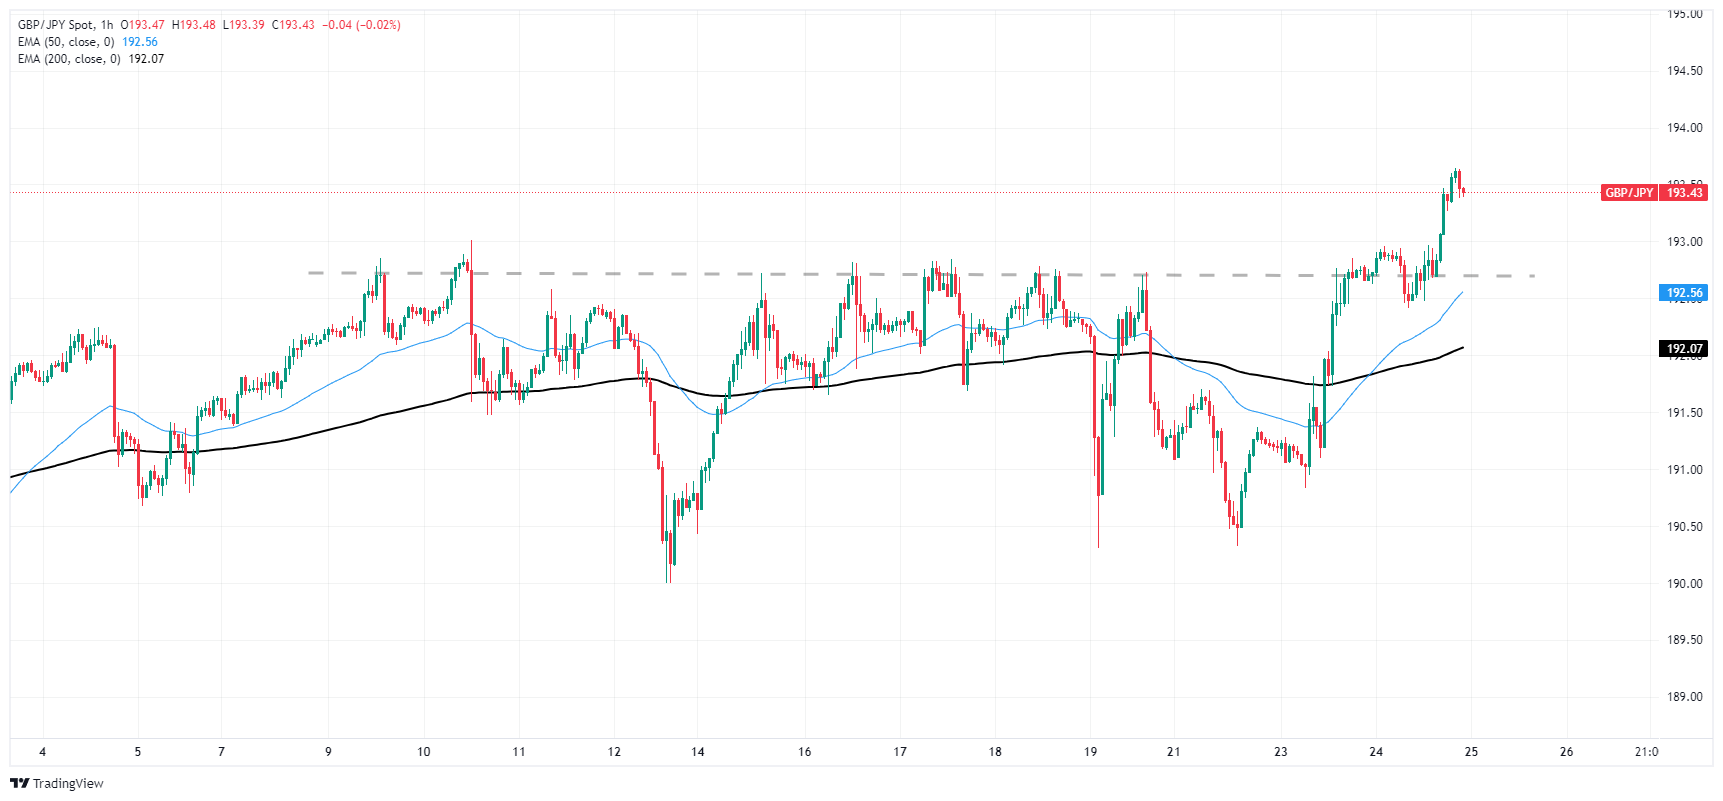
GBP/JPY daily chart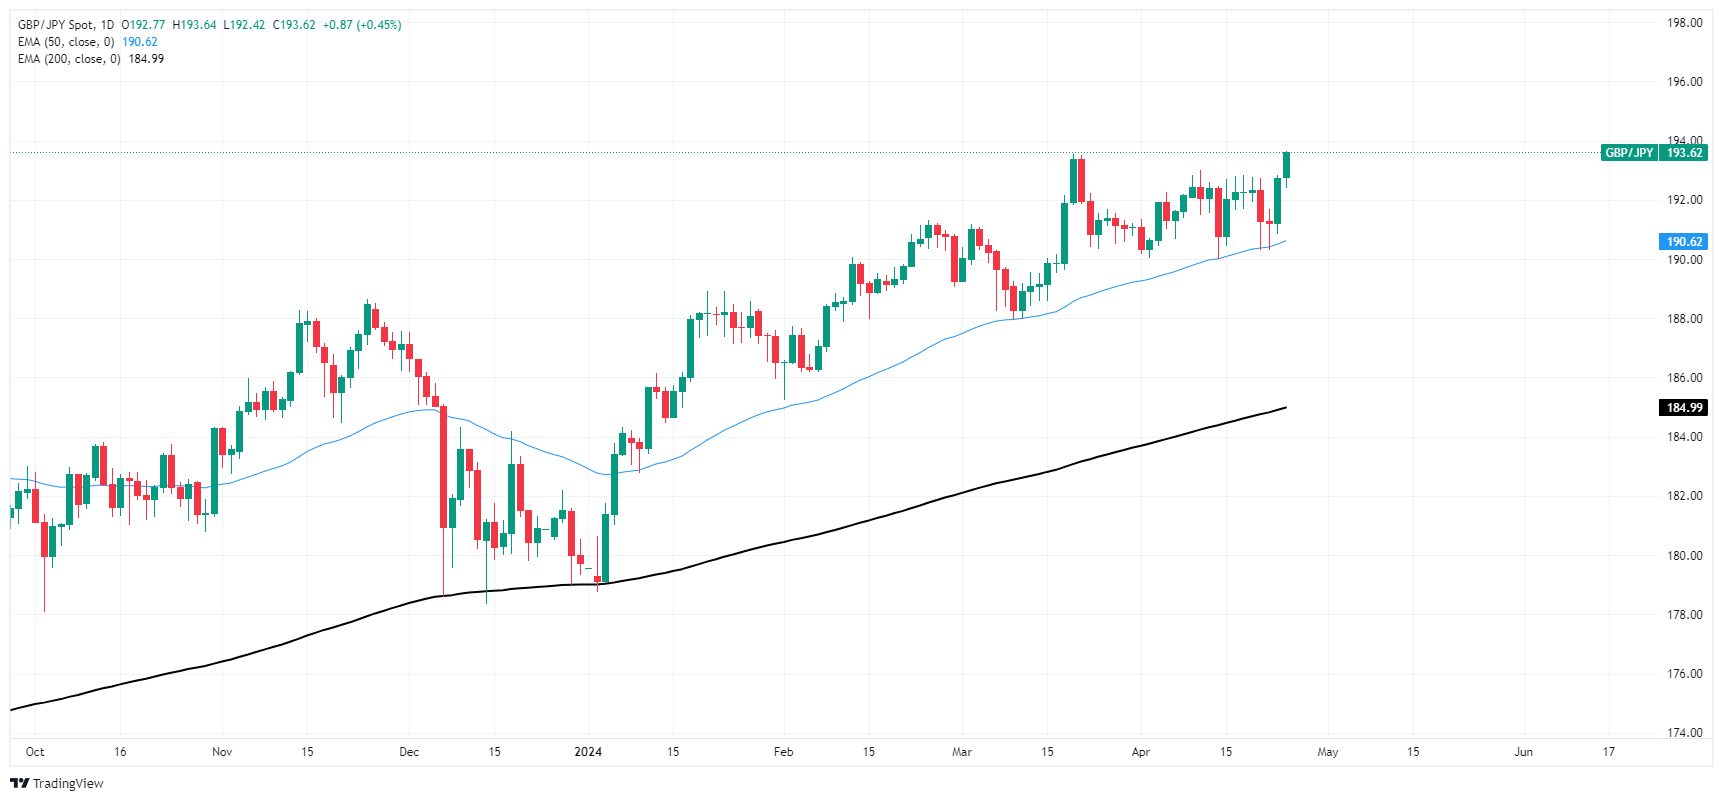
Recommended Articles


