EUR/GBP Price Analysis: Downmove reaches critical support level

Source Fxstreet
  • EUR/GBP price has fallen to support from the top of a multi-month range at 0.8590. 
  • Despite bearish signs the pair could yet rally as the short-term trend remains technically bullish. 
  • A decisive break below the support level, however, would indicate deeper decline back into the range.  

EUR/GBP price has reversed and fallen to a key support level at around 0.8590, where it is currently consolidating. 

During volatile trading on April 19 the pair broke out of its multi-month range and rose up to a peak of 0.8645, however, it quickly reversed and fell back down. 

EUR/GBP Daily Chart
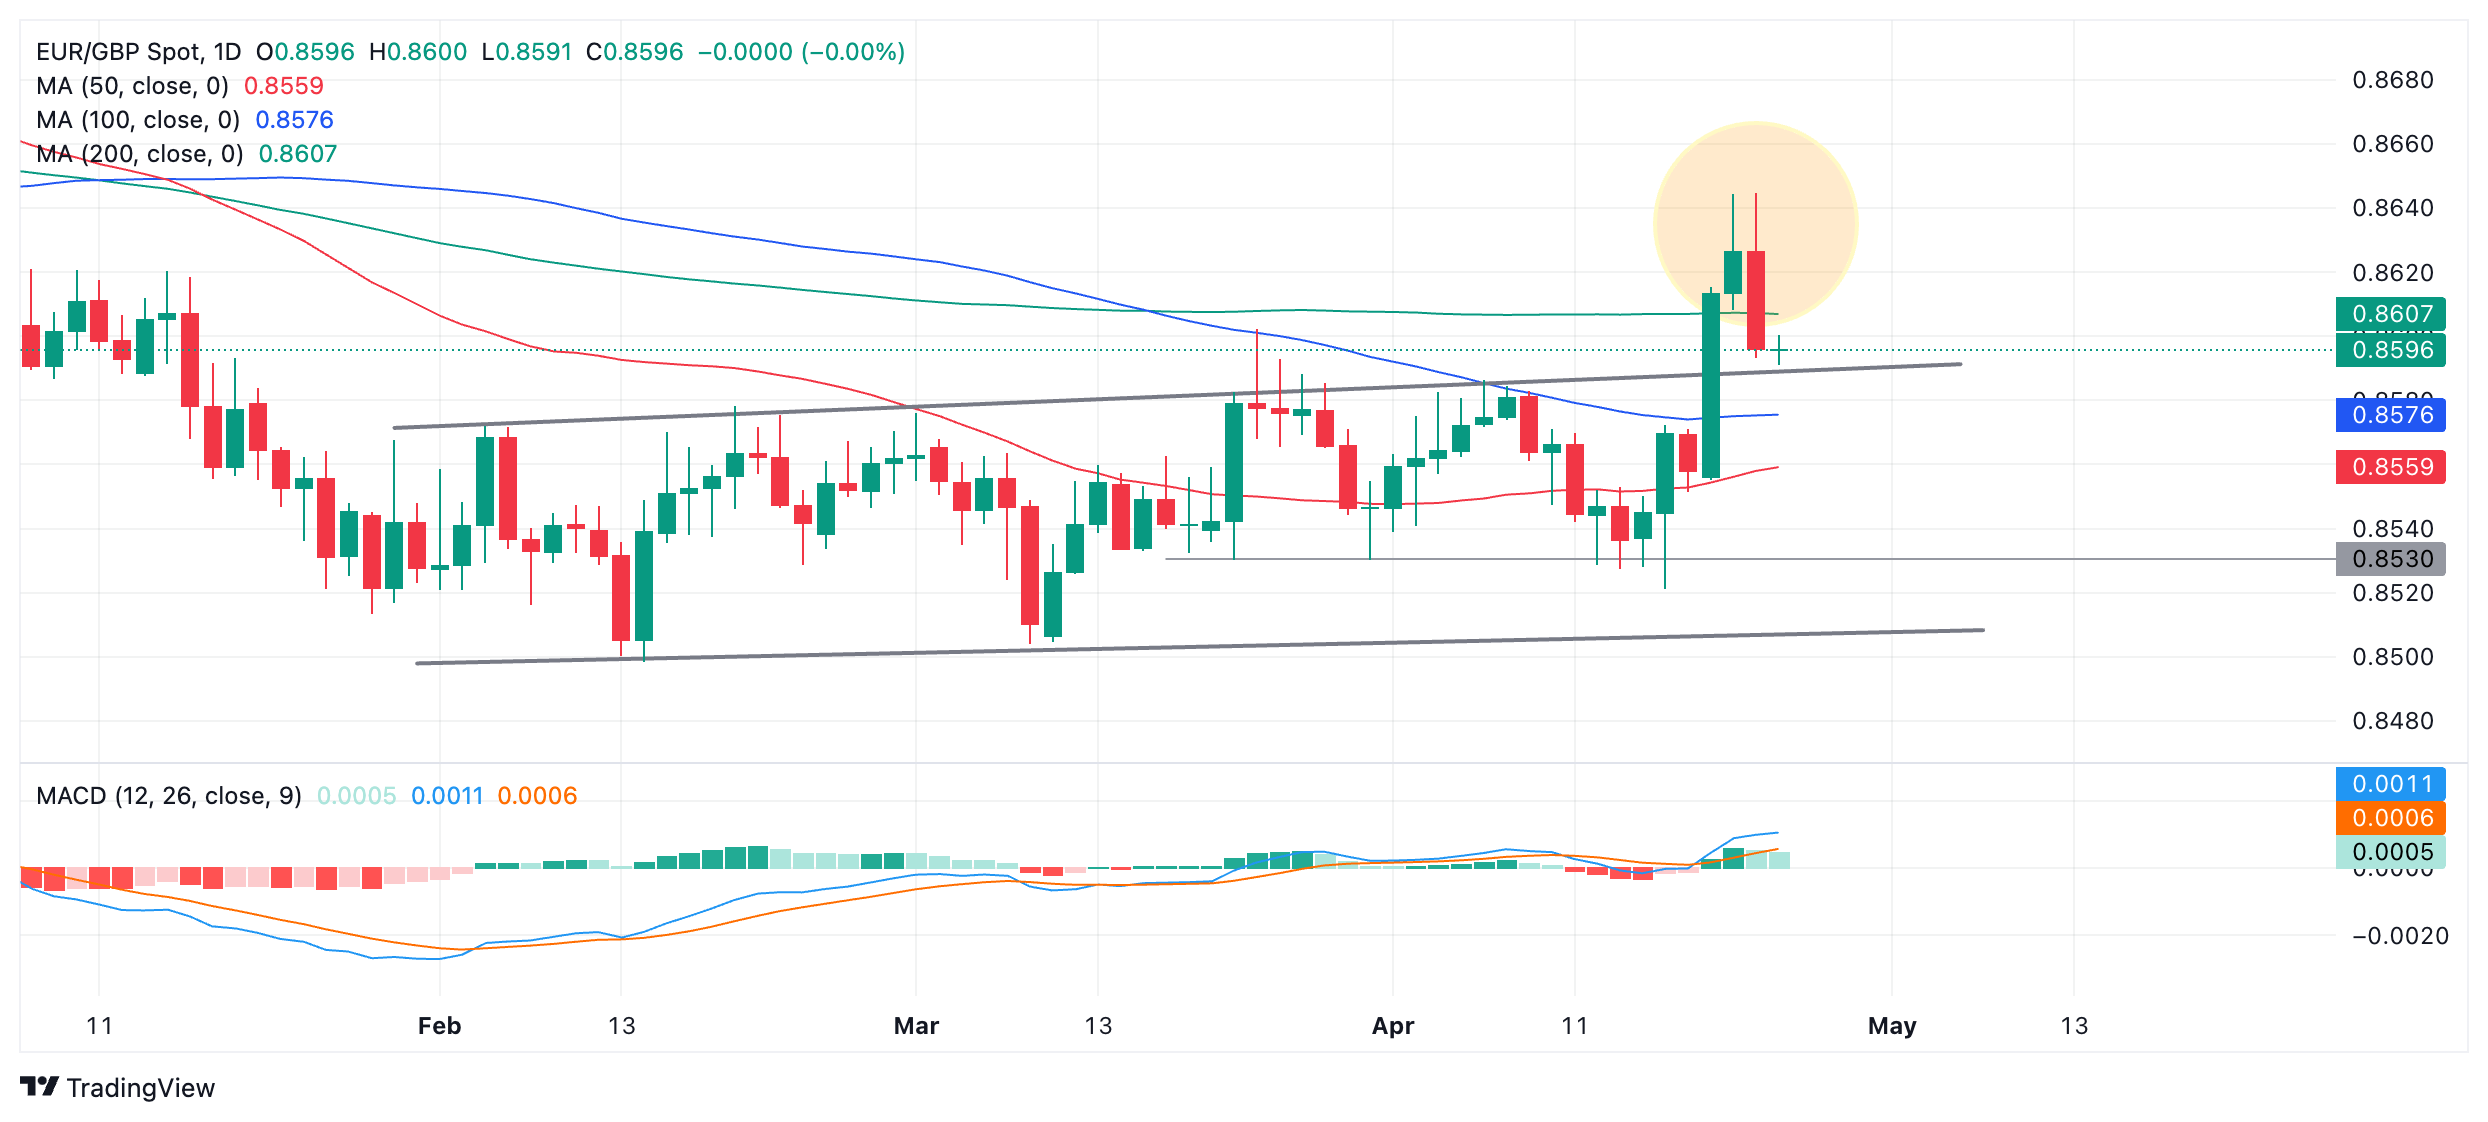


EUR/GBP hit its initial conservative target for the range breakout at the 0.618 Fibonacci extrapolation of the height of the range higher. This could mean there will be no further upside. However, if the pair reaches the optimistic target for the breakout it could still rally up to roughly 0.8660. 

The pair formed a bearish Tweezer Top Japanese candlestick pattern at the highs (circled) which occurs when two consecutive days have similar candle wicks (the thin upper part of the candle) and these wicks end at similar highs. It is a fairly reliable reversal sign. 

The support level currently holding up price is the top of a range that began in February. It is likely to be a tough nut for bears to crack and push price lower. 

A decisive break below the top of the range would be required to confirm more weakness possible to a target at 0.8530. 

“Decisive” means a break by a long red candlestick that closes near its low or a break by three consecutive red candlesticks. 

4-hour Chart 
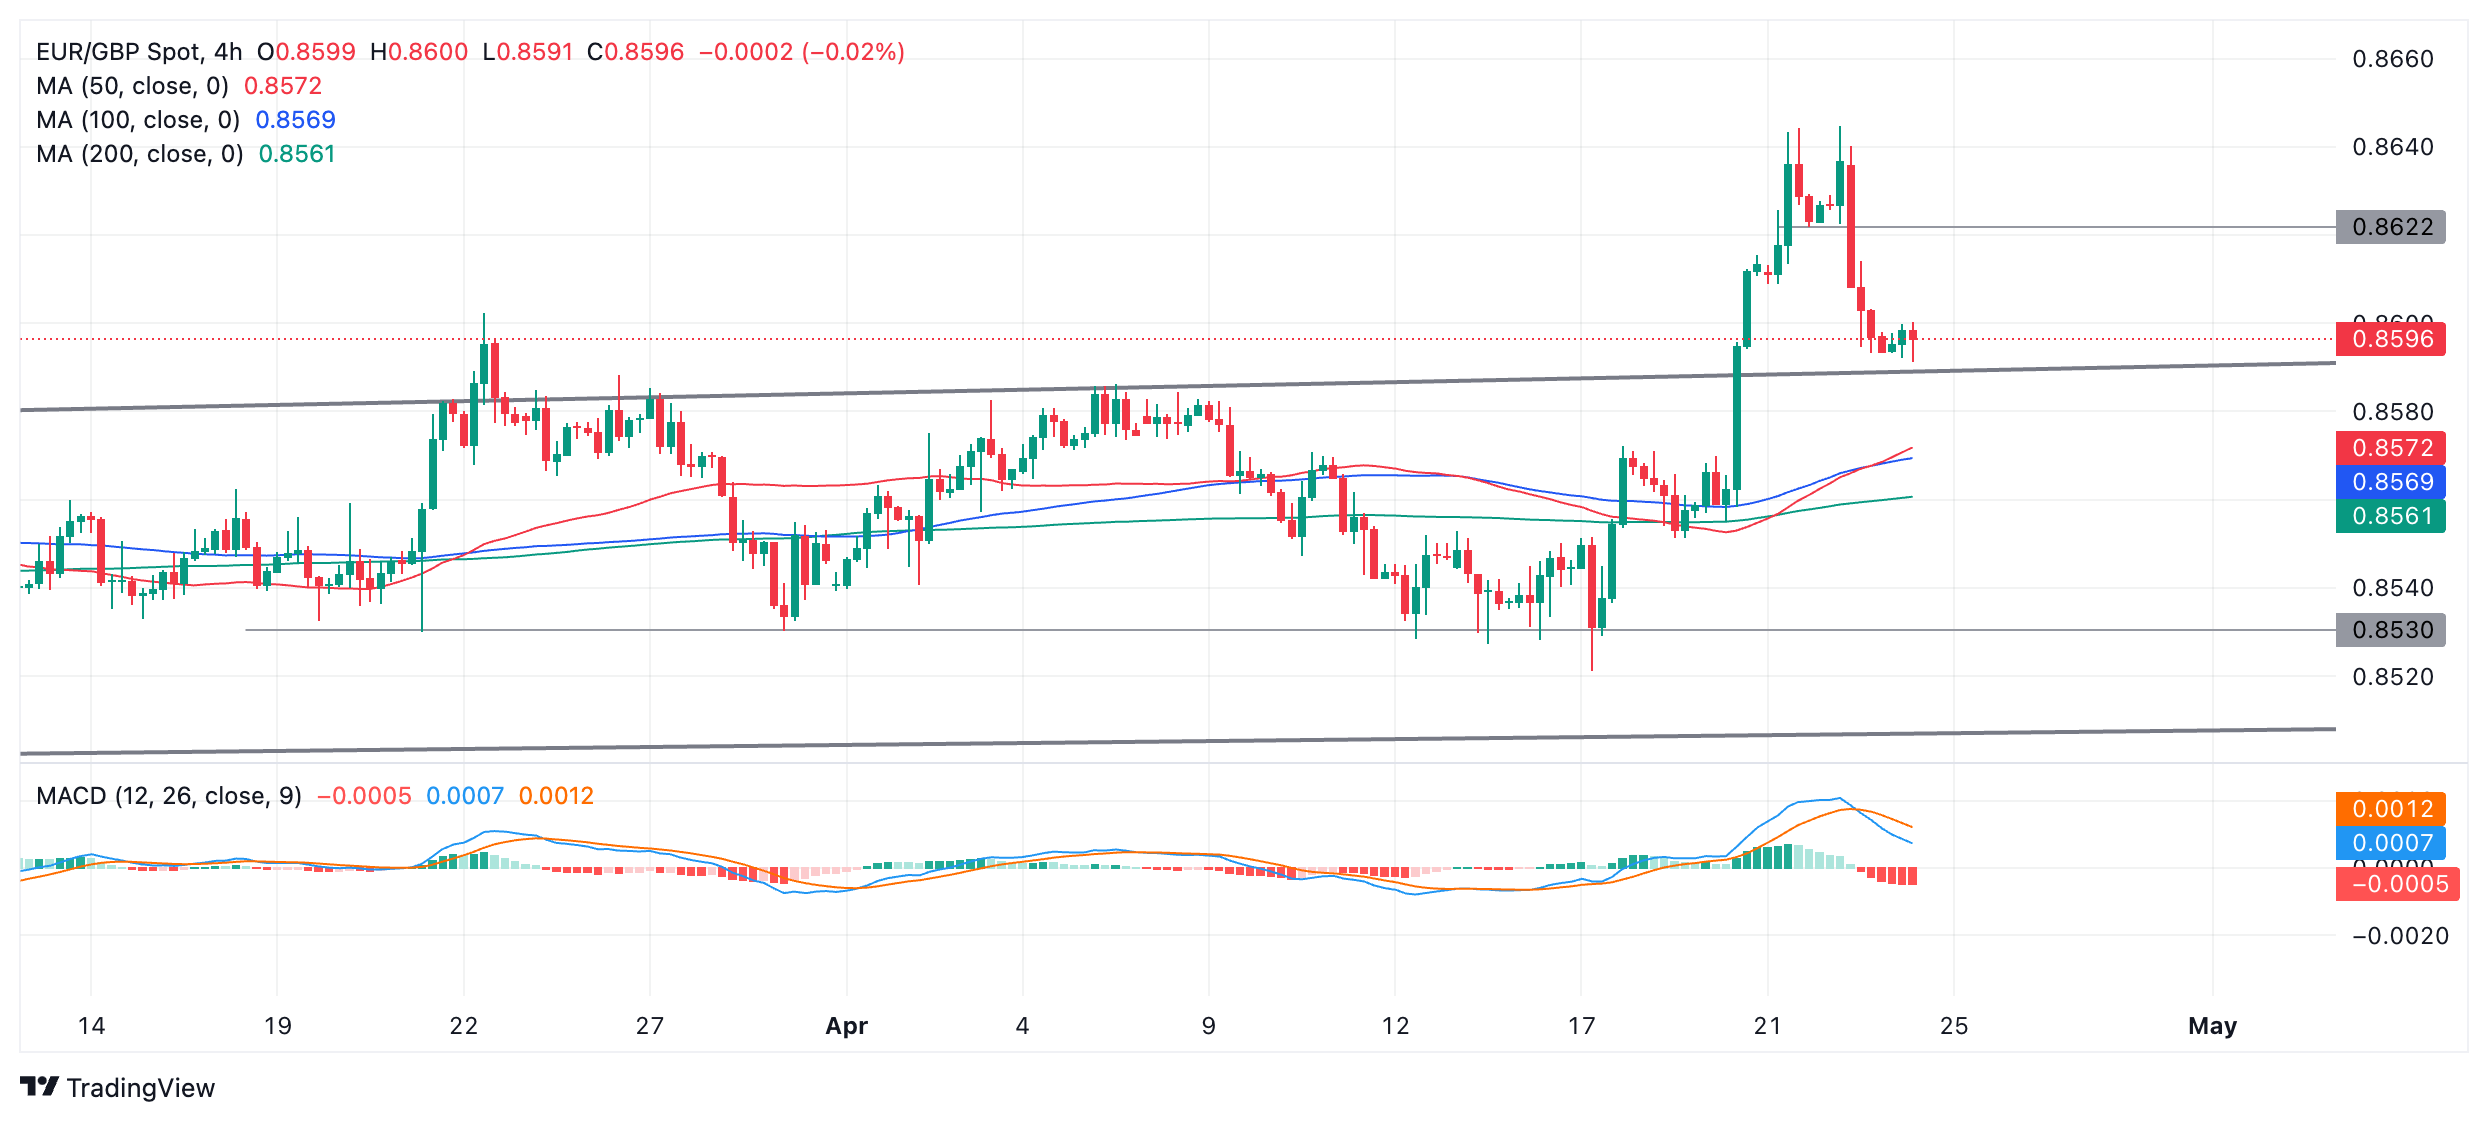
The 4-hour chart shows that a bearish M-shaped Double Top pattern formed at the highs of April 22-23. The pattern subsequently broke below its neckline (gray line at 0.8622) and plummeted. It has reached its price target which is equivalent to the height of the pattern extrapolated lower. This  suggests a waning in bearish momentum. 

The pair is not technically in a short-term downtrend despite recent weakness. Ideally it would need to form a more consistent trend of falling peaks and troughs before it could be said to be in a downtrend. 

Since there remains a chance EUR/GBP could still be in an uptrend, and that support from the top of the range has not yet been broken, the materialization of further upside is still a very real possibility.  

The level of the neckline of the Double Top at 0.8622 is likely to present resistance if an upmove evolves.


Disclaimer: For information purposes only. Past performance is not indicative of future results.
placeholder
2025 Black Friday is coming! Which stocks may see volatility?Coming on the day right after Thanksgiving in the United States, Back Friday marks the start of the holiday shopping season. Sales data from this shopping frenzy day reflects investor confidence and consumer trends. The National Retail Federation (NRF) predicts that holiday season (Nov and Dec) retail sales in 2025 will likely exceed $1 trillion for the very first time, which represents a year-over-year increase of 3.7 to 4.2 percent. Historic data from the past decade show that the retail sector has generally outperformed the S&P 500 during the weeks before and after Black Friday. The following retailing companies are expected to be big winners:
Author  Insights
Nov 24, Mon
Coming on the day right after Thanksgiving in the United States, Back Friday marks the start of the holiday shopping season. Sales data from this shopping frenzy day reflects investor confidence and consumer trends. The National Retail Federation (NRF) predicts that holiday season (Nov and Dec) retail sales in 2025 will likely exceed $1 trillion for the very first time, which represents a year-over-year increase of 3.7 to 4.2 percent. Historic data from the past decade show that the retail sector has generally outperformed the S&P 500 during the weeks before and after Black Friday. The following retailing companies are expected to be big winners:
placeholder
Bitcoin Targets $89K Breakout as S&P 500 Nears ATH on Fed Rate Cut HopesBitcoin price action shows signs of a potential short squeeze as it hovers near $88,000, with analysts watching liquidity dynamics that could push it toward $89,000 or retrace to $85,000.
Author  Mitrade
Yesterday 03: 31
Bitcoin price action shows signs of a potential short squeeze as it hovers near $88,000, with analysts watching liquidity dynamics that could push it toward $89,000 or retrace to $85,000.
placeholder
Bitcoin Price Forecast: BTC extends recovery as ETF records positive flows Bitcoin (BTC) price continues to trade in green above $91,500 at the time of writing on Thursday after rebounding from the key support level.
Author  FXStreet
Yesterday 10: 15
Bitcoin (BTC) price continues to trade in green above $91,500 at the time of writing on Thursday after rebounding from the key support level.
placeholder
Bitcoin Takes a 'Major Leap Forward' with $97K Price Targets in SightBitcoin holds steady above $90,000 as traders eye $100,000, buoyed by Thanksgiving market lull.
Author  Mitrade
11 hours ago
Bitcoin holds steady above $90,000 as traders eye $100,000, buoyed by Thanksgiving market lull.
placeholder
Gold hits two-week top; eyes $4,200 as dovish Fed offsets USD uptick and risk-on moodGold (XAU/USD) attracts fresh buyers during the Asian session on Friday and climbs to a two-week high, with bulls now eyeing to reclaim the $4,200 mark amid dovish US Federal Reserve (Fed) expectations.
Author  FXStreet
7 hours ago
Gold (XAU/USD) attracts fresh buyers during the Asian session on Friday and climbs to a two-week high, with bulls now eyeing to reclaim the $4,200 mark amid dovish US Federal Reserve (Fed) expectations.
goTop
quote