NZD/USD Price Analysis: Slight bullish momentum noted, long-term bearish bias intact

Source Fxstreet
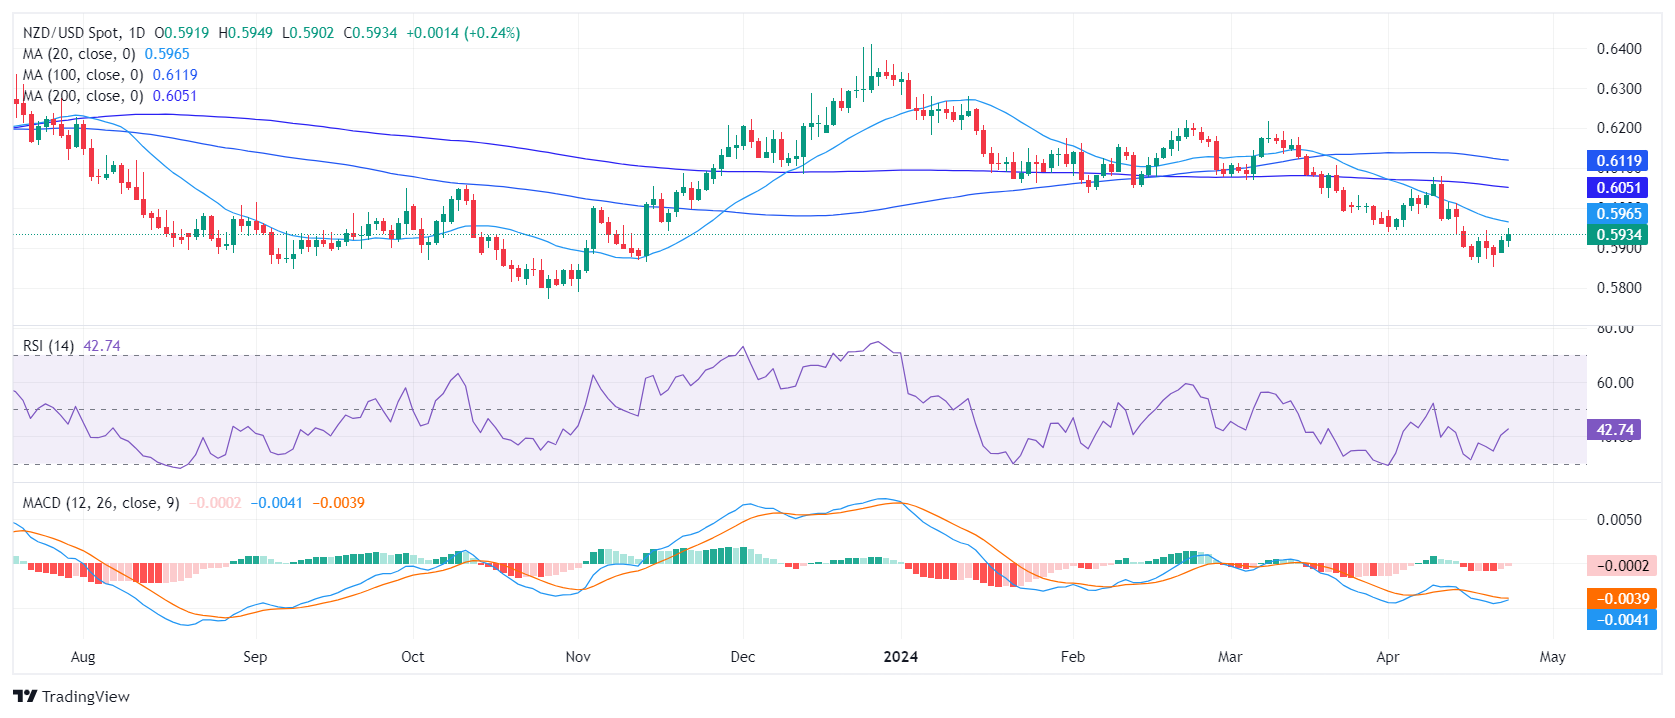
  • The RSI of the NZD/USD on the daily chart shows a slight recovery from the buyers.
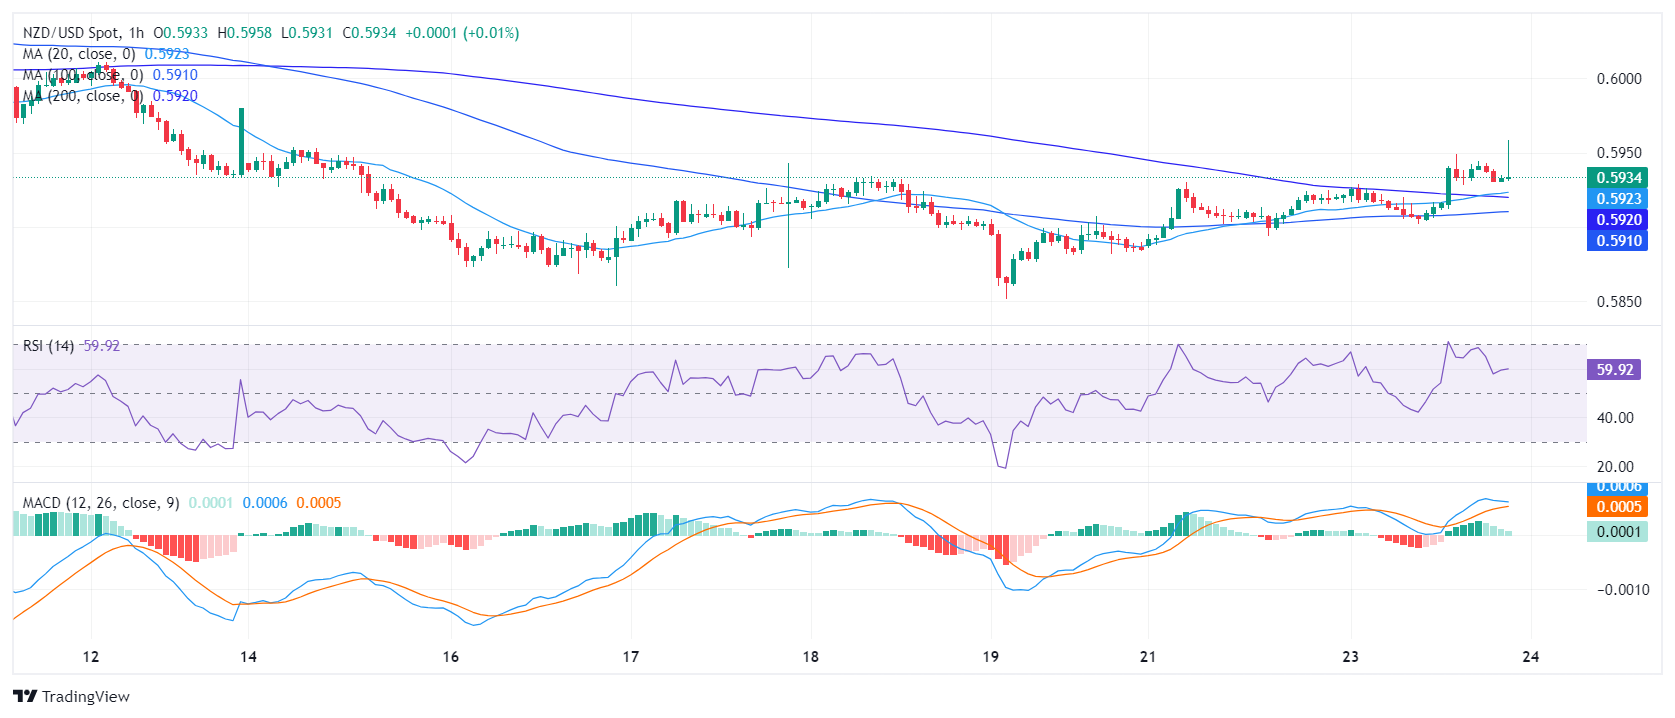
  • The hourly chart presents a more positive picture, with RSI remaining above 50, signaling increasing buying momentum.

The NZD/USD trades rose to 0.5930 in Tuesday’s session, marking a slight increase with gains of 0.17%. The currency pair continues to be guided by a long-term bearish trend. However, there is an attempt to challenge this bearish supremacy by buyers, albeit modest, and hourly indicators suggest that the momentum picked up is still weak.

On the daily chart, the Relative Strength Index (RSI) reveals a slight recovery showing a reading of 43, still within the negative territory, but suggesting a recent shift in bias among traders from negative to possibly a more positive trend. The decreasing red bars of the Moving Average Convergence Divergence (MACD) also support a weakening of the selling traction and a possible shift.

NZD/USD daily chart
The hourly Relative Strength Index (RSI) presents a more upbeat picture, remaining above the 50 level, with a recent peak close to the 70 level. The latest reading stands at 57.75, providing a boost in momentum. Concurrently, the hourly Moving Average Convergence Divergence (MACD) registers decreasing green bars, indicating weak buying traction.

NZD/USD hourly chart
In terms of the broader outlook, the NZD/USD resides in a definitive bearish stance as its latest position stays below the key Simple Moving Averages (SMA), of 20, 100, and 200-days SMA. This positioning suggests that the overall trend leans heavily towards the downside. In addition, positive signals were detected on the hourly and daily chart but those signals were not decisive buying signals as the buying momentum remains weak. Buyers must increase their efforts and reclaim the 20-day SMA to start talking.


NZD/USD

Overview
Today last price 0.5933
Today Daily Change 0.0014
Today Daily Change % 0.24
Today daily open 0.5919
 
Trends
Daily SMA20 0.5968
Daily SMA50 0.6058
Daily SMA100 0.6121
Daily SMA200 0.6053
 
Levels
Previous Daily High 0.593
Previous Daily Low 0.5886
Previous Weekly High 0.5954
Previous Weekly Low 0.5851
Previous Monthly High 0.6218
Previous Monthly Low 0.5956
Daily Fibonacci 38.2% 0.5913
Daily Fibonacci 61.8% 0.5903
Daily Pivot Point S1 0.5894
Daily Pivot Point S2 0.5868
Daily Pivot Point S3 0.585
Daily Pivot Point R1 0.5938
Daily Pivot Point R2 0.5956
Daily Pivot Point R3 0.5982


Disclaimer: For information purposes only. Past performance is not indicative of future results.
placeholder
Charlie Kirk’s Death Becomes a Crypto Flashpoint With ‘Justice’ TokensThe launch of new tokens following headline-making events is not new in the crypto market.
Author  Beincrypto
Sep 11, Thu
The launch of new tokens following headline-making events is not new in the crypto market.
placeholder
Solana Price Forecast: SOL eyes record highs as institutional demand, on-chain metrics underpin rallySolana (SOL) price trades in green, above $242 at the time of writing on Monday, after breaking out of a parallel channel last week with bulls aiming for record highs.
Author  FXStreet
Yesterday 05: 42
Solana (SOL) price trades in green, above $242 at the time of writing on Monday, after breaking out of a parallel channel last week with bulls aiming for record highs.
placeholder
Top 3 Price Prediction: BTC steadies, ETH finds support, XRP breaks bullish pattern Bitcoin (BTC), Ethereum (ETH), and Ripple (XRP) hover around key levels after recovering by nearly 4%, 7%, and 6%, respectively, last week.
Author  FXStreet
Yesterday 05: 44
Bitcoin (BTC), Ethereum (ETH), and Ripple (XRP) hover around key levels after recovering by nearly 4%, 7%, and 6%, respectively, last week.
placeholder
Gold bulls not ready to give up yet amid Fed rate cut bets and geopolitical risksGold (XAU/USD) kicks off the new week on a softer note, though it manages to reverse an Asian session dip to the $3,627-3,626 area and currently trades near the top end of a one-week-old trading range.
Author  FXStreet
Yesterday 05: 47
Gold (XAU/USD) kicks off the new week on a softer note, though it manages to reverse an Asian session dip to the $3,627-3,626 area and currently trades near the top end of a one-week-old trading range.
placeholder
Forex Today: Big central bank week begins in a calm mannerMajor currency pairs trade in familiar ranges to start the week as investors gear up for key macroeconomic data releases and central bank meetings.
Author  FXStreet
Yesterday 07: 35
Major currency pairs trade in familiar ranges to start the week as investors gear up for key macroeconomic data releases and central bank meetings.
Related Instrument
goTop
quote