CFDs are complex instruments and come with a high risk of losing money rapidly due to leverage. You should consider whether you understand how CFDs work and whether you can afford to take the high risk of losing your money.
    Mitrade Insights is dedicated to providing investors with rich, timely and most valuable financial information to help investors grasp the market situation and find timely trading opportunities.
    2021
    Best News & Analysis Provider
    FxDailyInfo
    2022
    Best Forex Educational Resources Global
    International Business Magazine

    NZD/JPY Price Analysis: Bullish strength persists, additional corrective pullbacks are possible

    Source Fxstreet
    Apr 23, 2024 19:44
    • The daily chart for NZD/JPY reveals continuing bullish momentum, with indicators in positive terrain.
    • The hourly indicators are correcting overbought conditions.

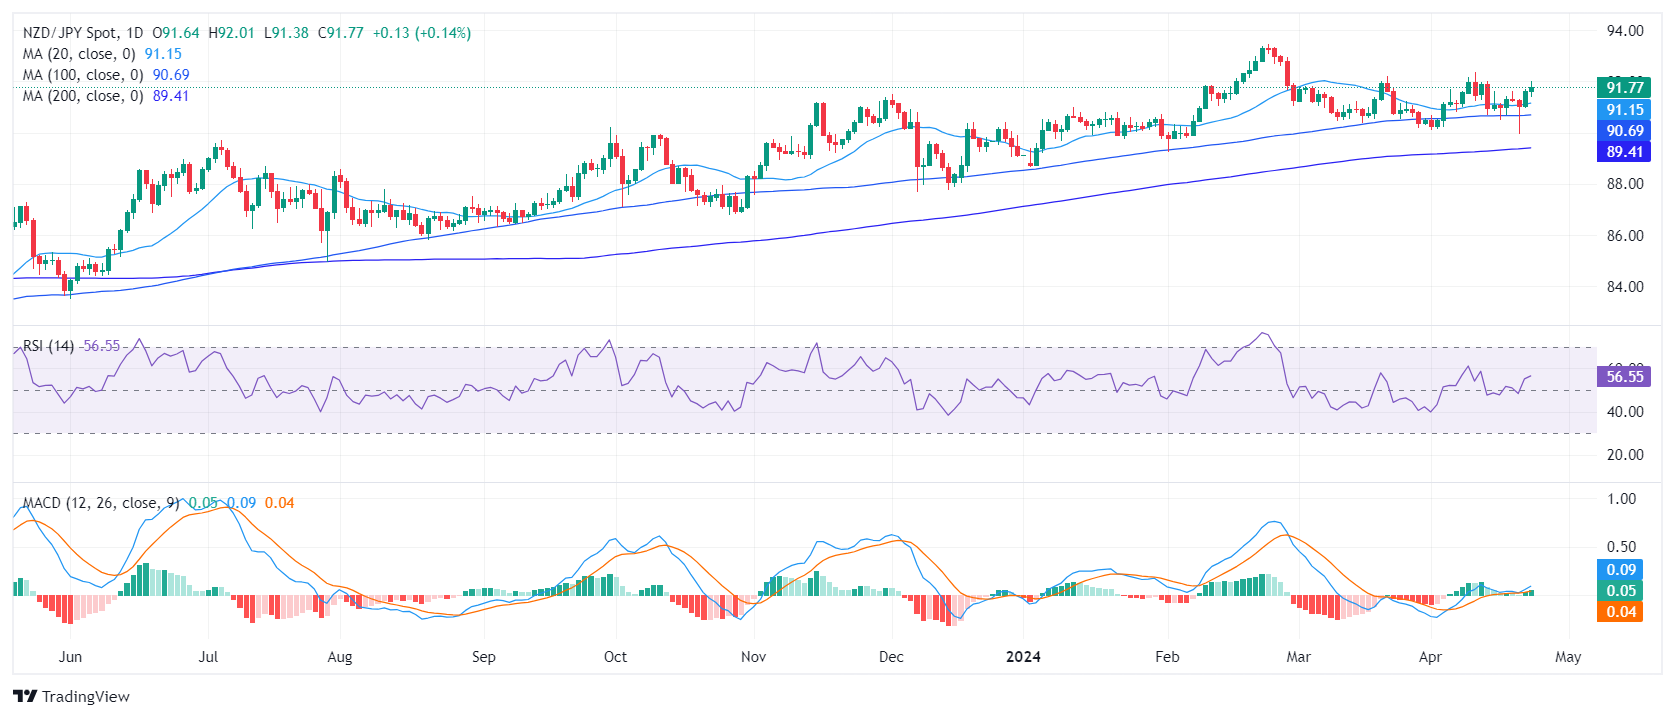
    The NZD/JPY tallied daily gains on Tuesday’s session and rose to 91.78. The pair maintains a solid footing above all main Simple Moving Averages (SMAs), which may signal additional strength despite intra-day pull-backs seen during the American session. Indicators remain strong on the daily chart but the hourly ones are losing traction as they are correcting overbought conditions.

    On the daily chart, the Relative Strength Index (RSI) for the NZD/JPY has been trending positively within the positive territory. The Moving Average Convergence Divergence (MACD) histogram also displays increasing green bars, indicating bullish momentum.

    NZD/JPY daily chart
    On the hourly chart, the RSI shows a reading of 68 but points south which reveals that buyers seem to be taking a breather as they hit overbought conditions earlier in the session. The hourly MACD, similar to the daily chart, also prints green bars, suggesting an ongoing upward trajectory.

    NZD/JPY hourly chart
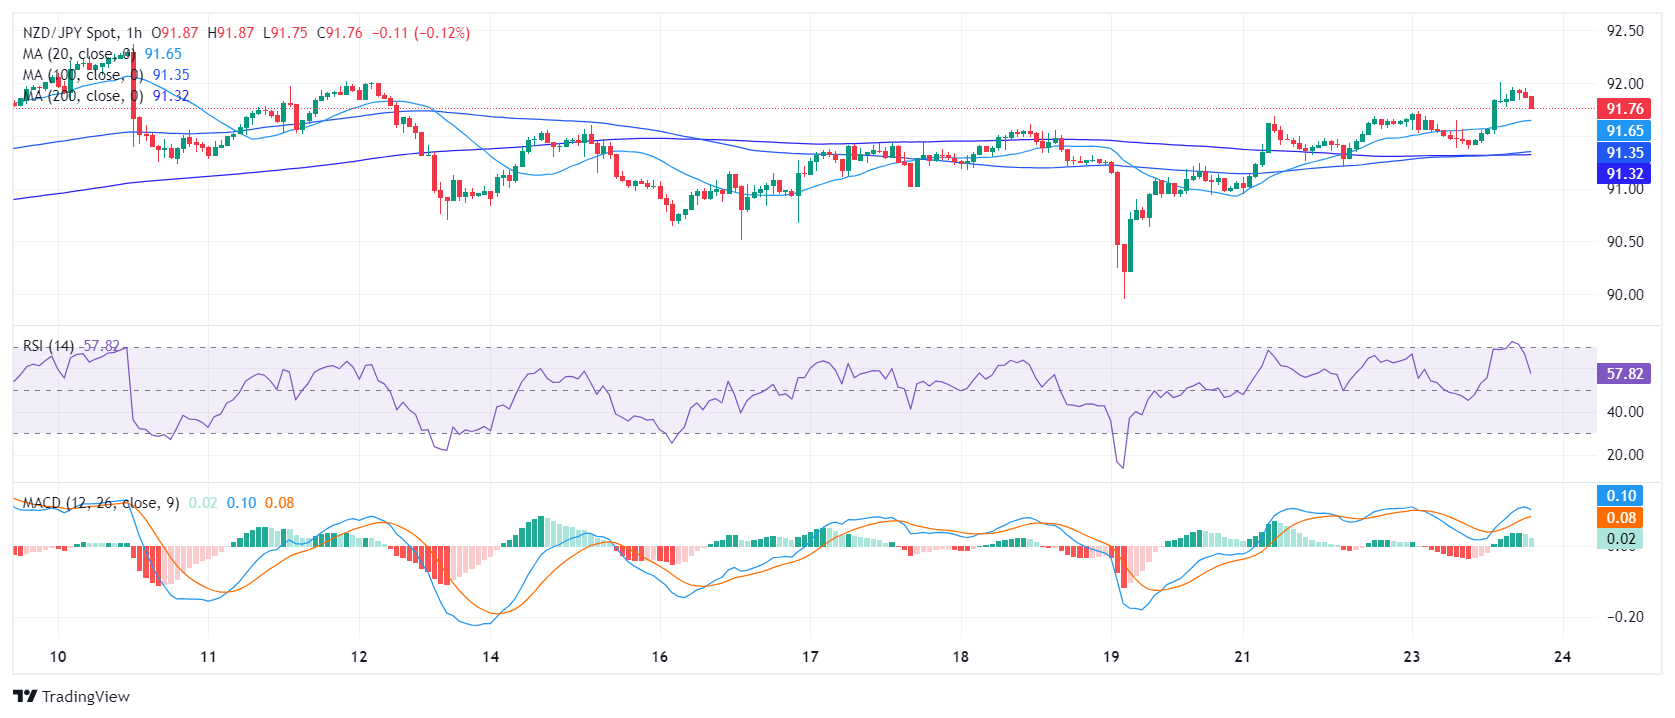
    Looking at the bigger picture, the NZD/JPY remains favourably positioned above its relevant Simple Moving Average (SMA) metrics, these being the 20, 100, and 200-day time horizons. However, ahead of the Asian session the pair may see further pullbacks as indicators start to lose traction on the hourly chart. One the other hand, the daily RSI and MACD remain strong and unless the bears conquer the 20-day SMA, the outlook will remain positive.


    NZD/JPY

    Overview
    Today last price 91.78
    Today Daily Change 0.14
    Today Daily Change % 0.15
    Today daily open 91.64
     
    Trends
    Daily SMA20 91.11
    Daily SMA50 91.43
    Daily SMA100 90.67
    Daily SMA200 89.38
     
    Levels
    Previous Daily High 91.69
    Previous Daily Low 90.95
    Previous Weekly High 91.62
    Previous Weekly Low 89.96
    Previous Monthly High 92.2
    Previous Monthly Low 90.17
    Daily Fibonacci 38.2% 91.41
    Daily Fibonacci 61.8% 91.23
    Daily Pivot Point S1 91.16
    Daily Pivot Point S2 90.69
    Daily Pivot Point S3 90.43
    Daily Pivot Point R1 91.9
    Daily Pivot Point R2 92.16
    Daily Pivot Point R3 92.64


    Disclaimer: For information purposes only. Past performance is not indicative of future results.
    placeholder
    EUR/USD jitters on reaction to Fed rate hold, FOMC press conference still on the cardsEUR/USD bumped slightly higher after the Federal Reserve (Fed) released its latest rate outlook, with the US central bank citing an improvement in inflationary conditions, though targets remain unhit.
    Source  Fxstreet
    EUR/USD bumped slightly higher after the Federal Reserve (Fed) released its latest rate outlook, with the US central bank citing an improvement in inflationary conditions, though targets remain unhit.
    placeholder
    USD/CAD Price Analysis: Hovers near 1.3700 within the ascending channelUSD/CAD consolidates within the ascending channel on the daily chart, with the 14-day Relative Strength Index (RSI) positioned above 50, indicating a recovery of bullish sentiment.
    Source  Fxstreet
    USD/CAD consolidates within the ascending channel on the daily chart, with the 14-day Relative Strength Index (RSI) positioned above 50, indicating a recovery of bullish sentiment.
    placeholder
    Mexican Peso pauses in recovery ahead of Mexican GDP dataThe Mexican Peso (MXN) has stalled after rallying against most counterparts over recent sessions.
    Source  Fxstreet
    The Mexican Peso (MXN) has stalled after rallying against most counterparts over recent sessions.
    goTop
    quote