

GBP/USD flat near 1.3380 as strong US data boosts the USD
- GBP/USD stalls after failing to reclaim the 200-day SMA as solid US jobs data underpins the Dollar.
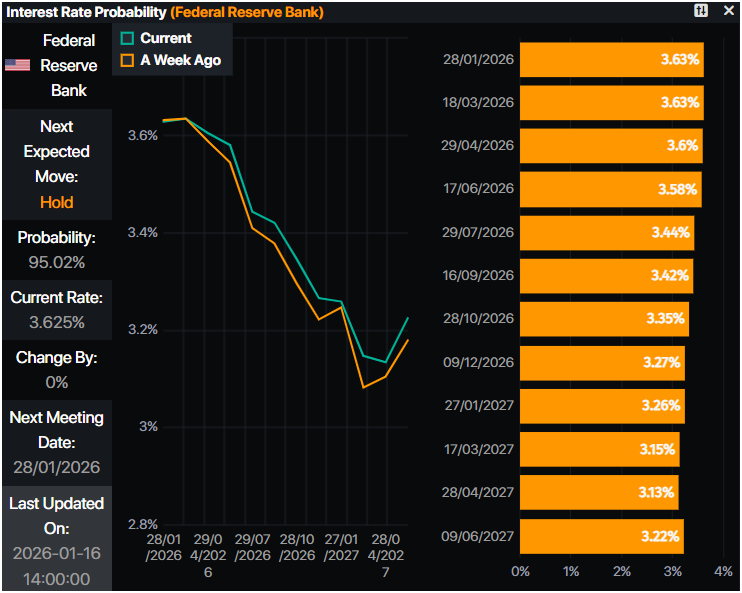
- Markets slash Fed easing expectations to 44 bps, boosting DXY toward recent highs.
- Focus shifts to UK jobs, inflation and US Core PCE for next week’s direction.
The British Pound trades sideways on Friday during the North American session, after reaching a daily high of 1.3413, but solid US data revealed in the week capped Sterling’s advance. The GBP/USD trades at 1.3380 and continues to distance from the 200-day SMA key technical level at 1.3405.
Dollar supported by solid US jobs data, traders trimming Fed cut bets
Last week, economic data in the US revealed that inflation in the consumer side stabilized, but not so on the producer front. Annually, the Consumer Price Index (CPI) hit 2.7% barely unchanged from November’s print, but the Producer Price Index (PPI) in November increased by 3%, up from 2.8% in the previous month.
In addition to this, the labor market had shown signs of strength following last Friday’s Nonfarm Payrolls report, which was solid despite missing forecasts while the Unemployment Rate ticked below the Fed’s forecast of 4.5% at 4.4%. Initial Jobless Claims reported on Thursday, dipped from 207K to 198K, an indication that fewer Americans are applying for unemployment benefits.
Consequently, markets had trimmed their expectations for rate cuts by the Fed, hence propelling the Dollar higher.
Data from Prime Market Terminal shows that traders had priced in 44 basis points of easing towards the end of the year, down from the peak of almost 60 bps of cuts projected by investors.
The US Dollar Index (DXY), which tracks the buck’s value versus its peers, is up 0.10% at 99.43, a headwind for the Pound.
On the other side the British Pound appreciated versus the Euro but not so against the US Dollar, even though data revealed that the UK economy grew above estimates in November 2025. Despite this, money markets continued to price at least two 25 basis points rate cuts by the Bank of England, in 2026.
Next week, the UK docket will feature jobs, inflation and retail sales data. Across the pond, the US schedule will feature housing data and the Fed’s preferred inflation gauge the Core Personal Consumption Expenditures (PCE) Price Index for October and November.
GBP/USD Price Forecast: Technical outlook
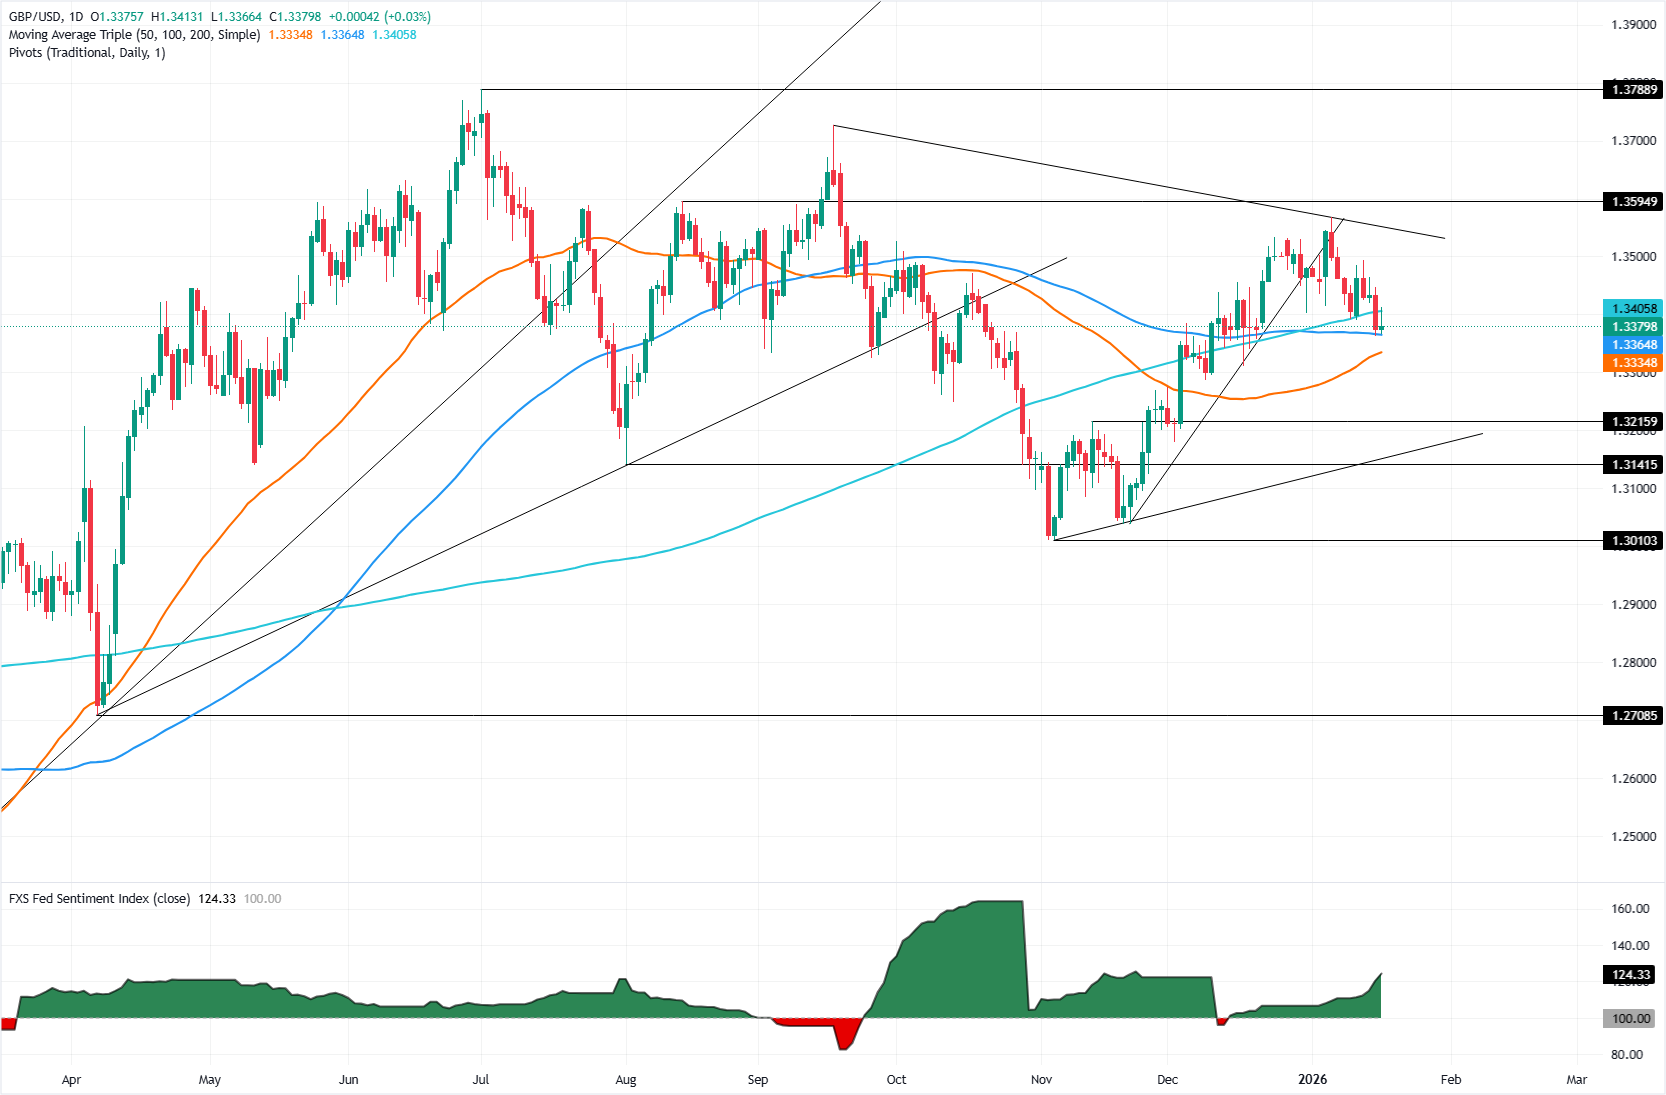
Short term, the GBP/USD has turned bearish after clearing a support trendline drawn from late November’s lows was broken on January 6. Since then the pair consolidated briefly above the 200-day SMA at 1.3405, before diving beneath the latter to new yearly lows of 1.3366.
A daily close below 1.34 would pave the way for challenging the 50-day SMA at 1.3334, followed by the November 13 high turned support at 1.3215 ahead of challenging a support trendline at around 1.3100-1.3150.
Conversely, if GBP/USD rises above 1.3400, traders could reclaim the 200-day SMA, followed by 1.3450.
Pound Sterling Price This week
The table below shows the percentage change of British Pound (GBP) against listed major currencies this week. British Pound was the strongest against the Euro.
| USD | EUR | GBP | JPY | CAD | AUD | NZD | CHF | |
|---|---|---|---|---|---|---|---|---|
| USD | 0.31% | 0.14% | -0.08% | -0.01% | 0.00% | -0.31% | 0.25% | |
| EUR | -0.31% | -0.18% | -0.33% | -0.34% | -0.31% | -0.62% | -0.07% | |
| GBP | -0.14% | 0.18% | -0.15% | -0.15% | -0.13% | -0.45% | 0.10% | |
| JPY | 0.08% | 0.33% | 0.15% | 0.04% | 0.05% | -0.26% | 0.29% | |
| CAD | 0.01% | 0.34% | 0.15% | -0.04% | -0.00% | -0.30% | 0.25% | |
| AUD | -0.01% | 0.31% | 0.13% | -0.05% | 0.00% | -0.32% | 0.23% | |
| NZD | 0.31% | 0.62% | 0.45% | 0.26% | 0.30% | 0.32% | 0.54% | |
| CHF | -0.25% | 0.07% | -0.10% | -0.29% | -0.25% | -0.23% | -0.54% |
The heat map shows percentage changes of major currencies against each other. The base currency is picked from the left column, while the quote currency is picked from the top row. For example, if you pick the British Pound from the left column and move along the horizontal line to the US Dollar, the percentage change displayed in the box will represent GBP (base)/USD (quote).
Recommended Articles


