NZD/USD Price Analysis: Treads water around 0.5900 with a bearish sentiment

Source Fxstreet
  • NZD/USD maintains gains despite the bearish sentiment indicated by the technical analysis.
  • Traders might contemplate short positions if the pair breaks below the support area encompassing 0.5863 and 0.5850.
  • A pullback from the level of 0.5863 could lead the pair toward lower boundary of a symmetrical pattern around 0.5933.

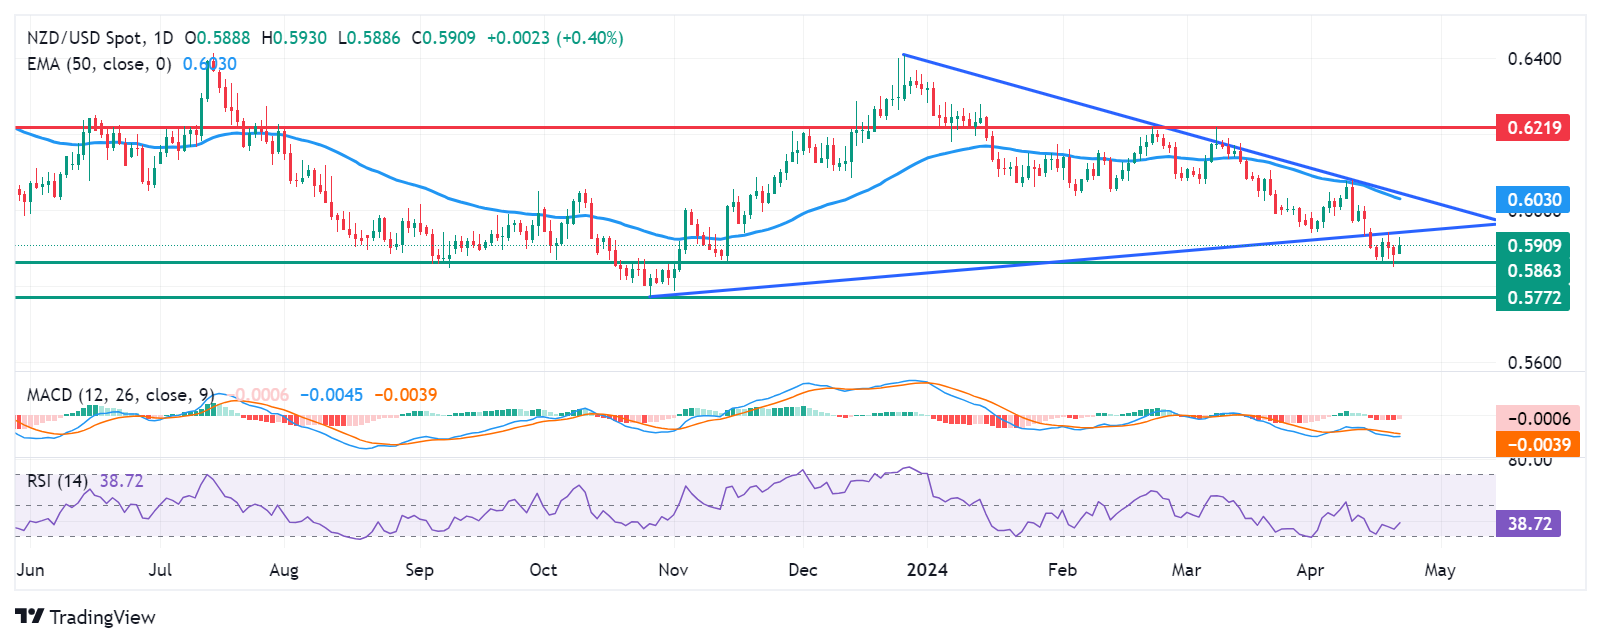
NZD/USD snaps its two-day losing streak, trading around 0.5910 during the European session on Monday. The recent break below the symmetrical channel on April 15 on the daily chart denotes a bearish sentiment.

Furthermore, analysis of the lagging indicator Moving Average Convergence Divergence (MACD) suggests a prevailing downward trend for the NZD/USD pair. This is evident from the MACD line's placement below the centerline and the signal line.

Additionally, the 14-day Relative Strength Index (RSI) remains below the 50 level, offering further confirmation of the bearish sentiment. This could prompt traders of the NZD/USD pair to focus on the region around the significant support levels of 0.5863 and 0.5850. Should these levels be breached, traders may consider short positions, potentially driving the pair to test the psychological barrier at 0.5800, followed by the support level of 0.5772.

Alternatively, if the pair rebounds from the support level of 0.5863, it could target the lower boundary of a symmetrical pattern around 0.5933 and the key level of 0.5950. A breakthrough above these levels might encourage traders to adopt long positions, shifting the sentiment towards bullish, with a potential aim to reach the 50-day Exponential Moving Average (EMA) positioned at 0.6030.

A break above the 50-day EMA will strengthen the bullish sentiment and test the upper boundary of the symmetrical pattern around 0.6043. A breakthrough at this level could prompt the traders to go bullish and approach the resistance barrier at 0.6219.

NZD/USD: Daily Chart

NZD/USD

Overview
Today last price 0.5908
Today Daily Change 0.0023
Today Daily Change % 0.39
Today daily open 0.5885
 
Trends
Daily SMA20 0.5973
Daily SMA50 0.6062
Daily SMA100 0.6123
Daily SMA200 0.6055
 
Levels
Previous Daily High 0.5907
Previous Daily Low 0.5851
Previous Weekly High 0.5954
Previous Weekly Low 0.5851
Previous Monthly High 0.6218
Previous Monthly Low 0.5956
Daily Fibonacci 38.2% 0.5873
Daily Fibonacci 61.8% 0.5886
Daily Pivot Point S1 0.5855
Daily Pivot Point S2 0.5825
Daily Pivot Point S3 0.5799
Daily Pivot Point R1 0.5911
Daily Pivot Point R2 0.5937
Daily Pivot Point R3 0.5967


Disclaimer: For information purposes only. Past performance is not indicative of future results.
placeholder
Trump’s Tariff Ruling Lands Today: Market to Rise or Fall — The Decision Will TellGlobal financial markets demonstrated strong performance at the beginning of 2026, fostering an optimistic atmosphere for early-year trading; however, this upward trend may face its first
Author  TradingKey
Yesterday 10: 58
Global financial markets demonstrated strong performance at the beginning of 2026, fostering an optimistic atmosphere for early-year trading; however, this upward trend may face its first
placeholder
Top 3 Price Prediction: Bitcoin, Ethereum, Ripple — BTC, ETH and XRP defend key support as rebound scenario stays in playBTC holds above $90,000, ETH hovers near $3,128 at the 50-day EMA, and XRP steadies above $2.07 as traders weigh rebound targets and key downside levels.
Author  Mitrade
Yesterday 09: 05
BTC holds above $90,000, ETH hovers near $3,128 at the 50-day EMA, and XRP steadies above $2.07 as traders weigh rebound targets and key downside levels.
placeholder
Bitcoin Trader Sticks to $76K Target as Early 2026 Rebound Loses MomentumBitcoin's recovery is in jeopardy with bearish predictions dominating sentiment as traders cite ongoing resistance and technical patterns hinting at further declines.
Author  Mitrade
Yesterday 08: 31
Bitcoin's recovery is in jeopardy with bearish predictions dominating sentiment as traders cite ongoing resistance and technical patterns hinting at further declines.
placeholder
EUR/USD steadies near 1.1650 ahead of US Nonfarm PayrollsEUR/USD holds ground after five days of losses, trading around 1.1650 during the Asian hours on Friday. Traders remain cautious ahead of the US Nonfarm Payrolls (NFP) report, which is expected to offer further insight into labor market conditions and the Federal Reserve’s (Fed) policy outlook.
Author  FXStreet
Yesterday 01: 44
EUR/USD holds ground after five days of losses, trading around 1.1650 during the Asian hours on Friday. Traders remain cautious ahead of the US Nonfarm Payrolls (NFP) report, which is expected to offer further insight into labor market conditions and the Federal Reserve’s (Fed) policy outlook.
placeholder
Bitcoin briefly dips under $90,000 as profit-taking drags ETH, XRP and BNB lowerBitcoin briefly slipped below $90,000 after hitting $94,000 earlier in the week, with ETH falling to $3,120 as traders cited profit-taking, $150 million in long liquidations, and macro uncertainty including U.S. jobs data and tariff-related Supreme Court risks.
Author  Mitrade
Jan 08, Thu
Bitcoin briefly slipped below $90,000 after hitting $94,000 earlier in the week, with ETH falling to $3,120 as traders cited profit-taking, $150 million in long liquidations, and macro uncertainty including U.S. jobs data and tariff-related Supreme Court risks.
Related Instrument
goTop
quote