NZD/USD Price Analysis: Defends crucial support of 0.5860

Source Fxstreet
  • NZD/USD bounces back from 0.5860 as the US Dollar edges down.
  • Investors see the RBNZ beginning to reduce interest rates from November.
  • The Kiwi asset trades inside the Descending Triangle pattern, suggesting indecisiveness among investors.

The NZD/USD pair turns sideways slightly below 0.5900 in Friday’s European session after recovering sharply from the crucial support of 0.5860.

The Kiwi asset rebounds as the appeal for risk-perceived currencies strengthens after economists cautioned about persistent global inflation. This has increased speculation that central banks other than the Federal Reserve (Fed) will also delay their rate-cut plans to avoid inflation getting rebound again. Initially, only the Fed was expected to begin reducing interest rates later this year due to stubbornly higher price pressures and robust labor demand.

Investors see the Reserve Bank of New Zealand (RBNZ) pivoting to rate cuts from November after NZ Q1 inflation data grew in line with estimates. Price pressures rose by 0.6% as estimated, higher than the prior reading of 0.5%.

The US Dollar Index (DXY) falls slightly to 106.10. The near-term outlook remains strong as the Federal Reserve (Fed) sees interest rates remaining higher for long enough so that inflation could sustainably return to the desired rate of 2%. Currently, traders see the Fed starting to reduce interest rates from the September meeting.

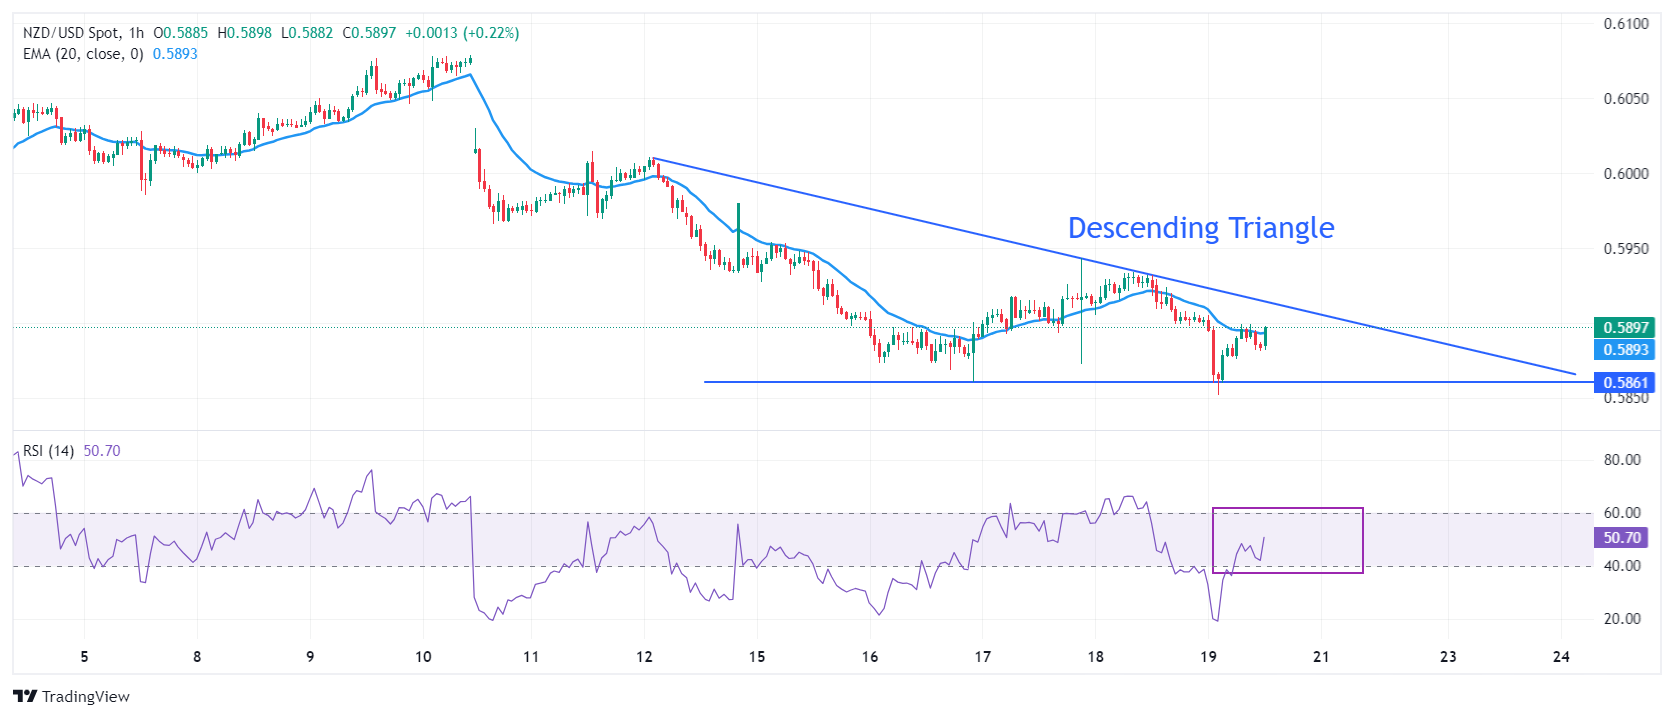
NZD/USD oscillates in a Descending Triangle chart pattern, which exhibits a sharp volatility contraction. The downward-sloping border of the above-mentioned chart pattern is plotted from April 12 high near 0.6000 while the horizontal support is placed from April 16 low at 0.5860.

The Kiwi asset attempts to break above the 20-period Exponential Moving Average (EMA), which trades around 0.5900.

The 14-period Relative Strength Index (RSI) recovers sharply above 40.00. However, the downside bias remains favored until the RSI breaks above 60.00.

Fresh downside would appear if the asset breaks below April 16 low at 0.5860. This would drag the asset toward 8 September 2023 low at 0.5847, followed by the round-level support of 0.5900

On the flip side, a recovery move above March 18 high at 0.6100 will drive the pair toward March 12 low at 0.6135. A breach of the latter will drive the asset further to February 9 high around 0.6160.

NZD/USD hourly chart
NZD/USD

Overview
Today last price 0.5899
Today Daily Change -0.0003
Today Daily Change % -0.05
Today daily open 0.5902
 
Trends
Daily SMA20 0.5978
Daily SMA50 0.6067
Daily SMA100 0.6127
Daily SMA200 0.6057
 
Levels
Previous Daily High 0.5943
Previous Daily Low 0.5872
Previous Weekly High 0.6079
Previous Weekly Low 0.5933
Previous Monthly High 0.6218
Previous Monthly Low 0.5956
Daily Fibonacci 38.2% 0.5899
Daily Fibonacci 61.8% 0.5916
Daily Pivot Point S1 0.5869
Daily Pivot Point S2 0.5835
Daily Pivot Point S3 0.5798
Daily Pivot Point R1 0.594
Daily Pivot Point R2 0.5977
Daily Pivot Point R3 0.6011


Disclaimer: For information purposes only. Past performance is not indicative of future results.
placeholder
Silver spikes up to $36.50 with markets turning cautiousSilver (XAG/USD) is extending its rebound from Monday’s lows at $35.40 to intra-day highs at $36.50.
Author  FXStreet
12 hours ago
Silver (XAG/USD) is extending its rebound from Monday’s lows at $35.40 to intra-day highs at $36.50.
placeholder
EUR/GBP keeps the red above mid-0.8500s after Eurozone inflation dataThe EUR/GBP cross retreats from the vicinity of the 0.8600 mark, or its highest level since April 23 touched earlier this Tuesday and sticks to modest intraday gains through the first half of the European session.
Author  FXStreet
13 hours ago
The EUR/GBP cross retreats from the vicinity of the 0.8600 mark, or its highest level since April 23 touched earlier this Tuesday and sticks to modest intraday gains through the first half of the European session.
placeholder
Dollar Endures Worst Half in Decades: What's Next for 2025?The dollar experienced its weakest first half in more than 50 years, hurt by geopolitical tensions and former President Donald Trump's trade policies.
Author  Insights
13 hours ago
The dollar experienced its weakest first half in more than 50 years, hurt by geopolitical tensions and former President Donald Trump's trade policies.
placeholder
XRP, ETH Traders Getting Greedy? Funding Rates Highest Among Top CoinsData shows XRP and Ethereum top the Funding Rate charts among the major cryptocurrencies, a sign of growing demand for long positions.
Author  Bitcoinist
13 hours ago
Data shows XRP and Ethereum top the Funding Rate charts among the major cryptocurrencies, a sign of growing demand for long positions.
placeholder
Bitcoin Price Forecast: BTC slips below $107,000 even as exchange reserves hit 6-year low Bitcoin (BTC) slips below $107,000 at the time of writing on Tuesday, continuing a mild pullback from the previous day.
Author  FXStreet
13 hours ago
Bitcoin (BTC) slips below $107,000 at the time of writing on Tuesday, continuing a mild pullback from the previous day.
Related Instrument
goTop
quote