EUR/JPY Price Analysis: Bulls Maintain Control, consolidation phase likely

Source Fxstreet
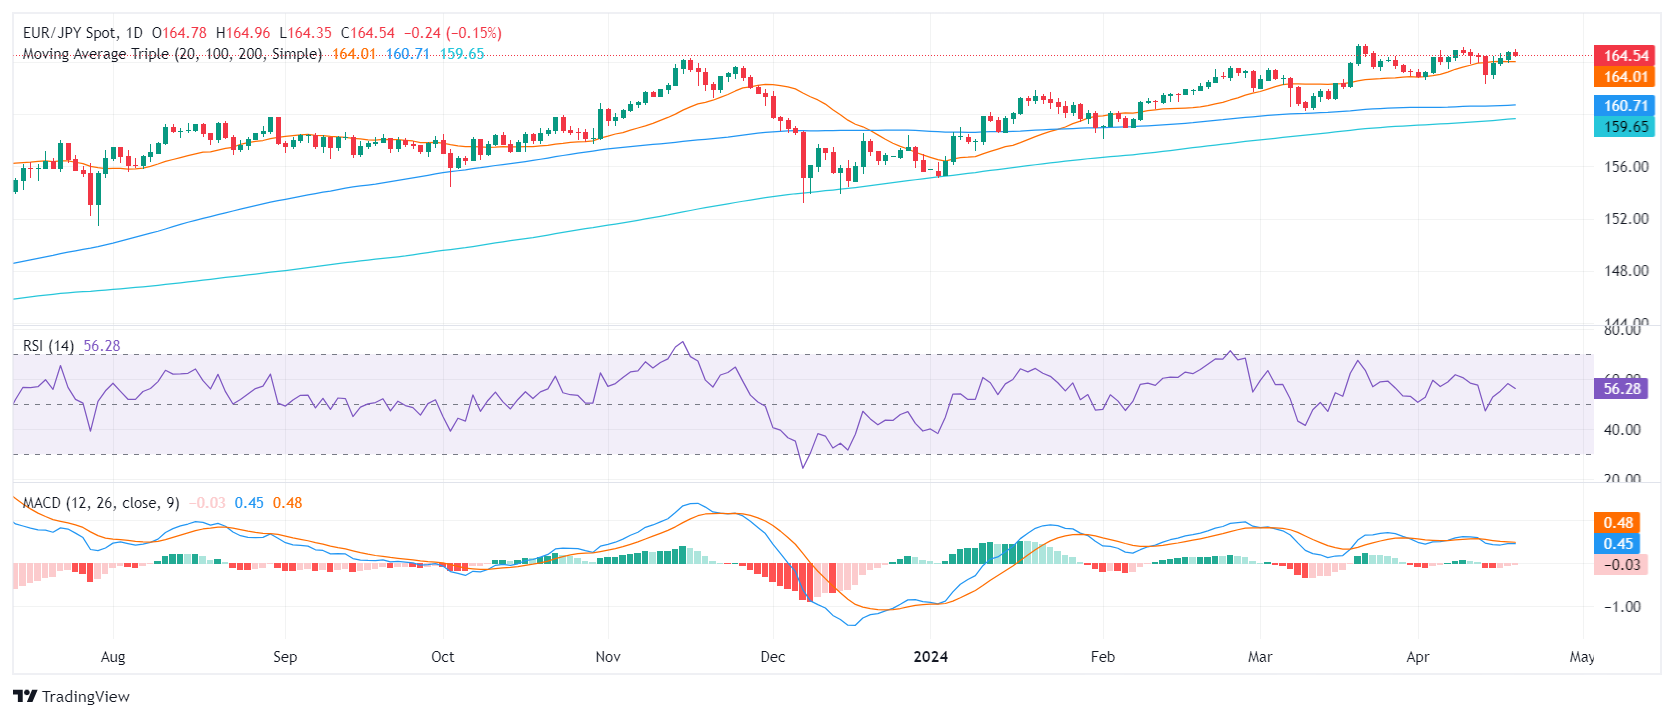
  • The RSI on the daily chart of EUR/JPY indicates sustained bullish momentum.
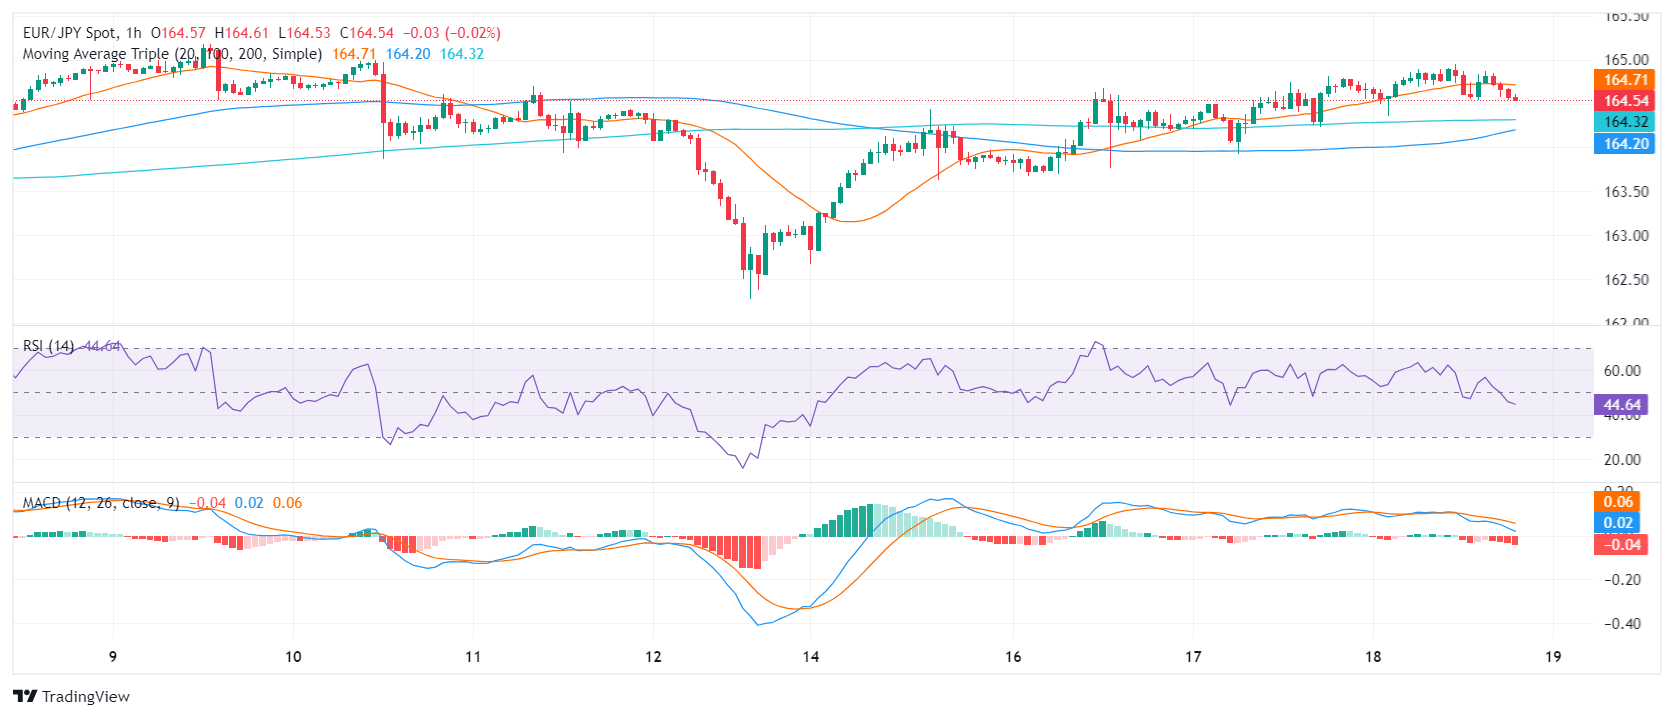
  • Hourly chart shows an RSI below its mid-zone and MACD with rising red bars, pointing towards possible consolidation.
  • The EUR/JPY's position above main SMAs underscores a strong bullish bias.

The EUR/JPY slightly declined to 164.70 in Thursday’s session. That being said, the overall trend still favors the bulls but a consolidation phase, suggested by bears dominating the hourly chart, may create a balanced playing field for both buyers and sellers ahead of the Asian session.

On the daily chart, the Relative Strength Index (RSI) for the EUR/JPY pair is in positive territory, with a most recent reading of 58. This suggests that the pair's upsurge might remain intact as long as the RSI stays above the 50 mark, indicating that buyers are in control at this moment.

EUR/JPY daily chart

Meanwhile, on the hourly chart, the EUR/JPY's RSI declined below its middle zone, with the latest reading of 44 as of the last hour. This could point towards a pending period of consolidation. The Moving Average Convergence Divergence (MACD) displays rising red bars, also hinting at a temporary slowdown in the bullish momentum.

EUR/JPY hourly chart

Regarding the Simple Moving Average (SMA), the cross EUR/JPY holds strong above its 20, 100, and 200-day SMAs, indicating a bullish stance. That being said the pair must defend the 20-day SMA at 164.00 which is a strong support to maintain the positive short-term outlook.


EUR/JPY

Overview
Today last price 164.56
Today Daily Change -0.22
Today Daily Change % -0.13
Today daily open 164.78
 
Trends
Daily SMA20 164.02
Daily SMA50 162.94
Daily SMA100 160.67
Daily SMA200 159.61
 
Levels
Previous Daily High 164.81
Previous Daily Low 163.93
Previous Weekly High 165.18
Previous Weekly Low 162.28
Previous Monthly High 165.36
Previous Monthly Low 160.22
Daily Fibonacci 38.2% 164.47
Daily Fibonacci 61.8% 164.27
Daily Pivot Point S1 164.2
Daily Pivot Point S2 163.62
Daily Pivot Point S3 163.32
Daily Pivot Point R1 165.09
Daily Pivot Point R2 165.39
Daily Pivot Point R3 165.97


Disclaimer: For information purposes only. Past performance is not indicative of future results.
placeholder
Ethereum (ETH) Price Closes Above $3,900 — Is a New All-Time High Possible Before 2024 Ends?Once again, the price of Ethereum (ETH) has risen above $3,900. This bounce has hinted at a further price increase for the altcoin before the end of the year.
Author  Beincrypto
Dec 17, 2024
Once again, the price of Ethereum (ETH) has risen above $3,900. This bounce has hinted at a further price increase for the altcoin before the end of the year.
placeholder
Markets in 2026: Will gold, Bitcoin, and the U.S. dollar make history again? — These are how leading institutions thinkAfter a turbulent 2025, what lies ahead for commodities, forex, and cryptocurrency markets in 2026?
Author  Insights
Dec 25, 2025
After a turbulent 2025, what lies ahead for commodities, forex, and cryptocurrency markets in 2026?
placeholder
Gold advances back closer to $5,200 mark amid geopolitical tensions and USD weaknessGold (XAU/USD) attracts some dip-buyers following the previous day's modest pullback from the monthly top and climbs back closer to the $5,200 mark during the Asian session on Wednesday.
Author  FXStreet
Feb 25, Wed
Gold (XAU/USD) attracts some dip-buyers following the previous day's modest pullback from the monthly top and climbs back closer to the $5,200 mark during the Asian session on Wednesday.
placeholder
Top 3 Price Prediction: Bitcoin, Ethereum, Ripple – BTC, ETH and XRP consolidate with short-term cautious bullish biasBitcoin (BTC), Ethereum (ETH) and Ripple (XRP) are consolidating near key technical areas on Friday, showing mild signs of stabilization after recent volatility.
Author  FXStreet
Feb 27, Fri
Bitcoin (BTC), Ethereum (ETH) and Ripple (XRP) are consolidating near key technical areas on Friday, showing mild signs of stabilization after recent volatility.
placeholder
Silver Price Forecast: XAG/USD jumps above $90 as AI valuation risks boost safe-haven demandSilver price (XAG/USD) is up 2.4% to near $90.60 during the European trading session on Friday. The white metal strengthens as escalating concerns over valuations of Artificial Intelligence (AI) stocks have prompted demand for safe-haven assets.
Author  FXStreet
Feb 27, Fri
Silver price (XAG/USD) is up 2.4% to near $90.60 during the European trading session on Friday. The white metal strengthens as escalating concerns over valuations of Artificial Intelligence (AI) stocks have prompted demand for safe-haven assets.
Related Instrument
goTop
quote