When are the German/ Eurozone flash HCOB PMIs and how could they affect EUR/USD?

Source Fxstreet

German/ Eurozone flash PMIs Overview

The preliminary German and Eurozone flash HCOB Purchasing Managers’ Index (PMI) data for December is due for release today at 08:30 and 09:00 GMT, respectively.

Amongst the Euro area economies, the German and the composite Eurozone PMI reports hold more relevance, in terms of their impact on the European currency and the related markets as well.

The flash Composite PMI for Germany is expected to come in slightly weaker due to a slowdown in the service sector activity. However, the overall business output is anticipated to hold above the 50.0 threshold, a level that separates expansion from contraction.

Preliminary Services PMI is seen at 52.8, lower than 53.1 in the final reading from November. The Manufacturing PMI is expected to have contracted again, but at a slower pace, to 48.5 from the prior reading of 48.2.

The forecast for the Eurozone flash Composite PMI shows that the overall private sector output increased at a faster pace in December due to an improvement in both manufacturing and the services sector activity. The Services PMI is seen at 53.9, up from 53.6 in November. Like the German Manufacturing PMI, the manufacturing activity in the old continent has contracted too, but at a moderate pace to 49.9 from the previous release of 49.6.

How could German/ Eurozone flash PMIs affect EUR/USD?

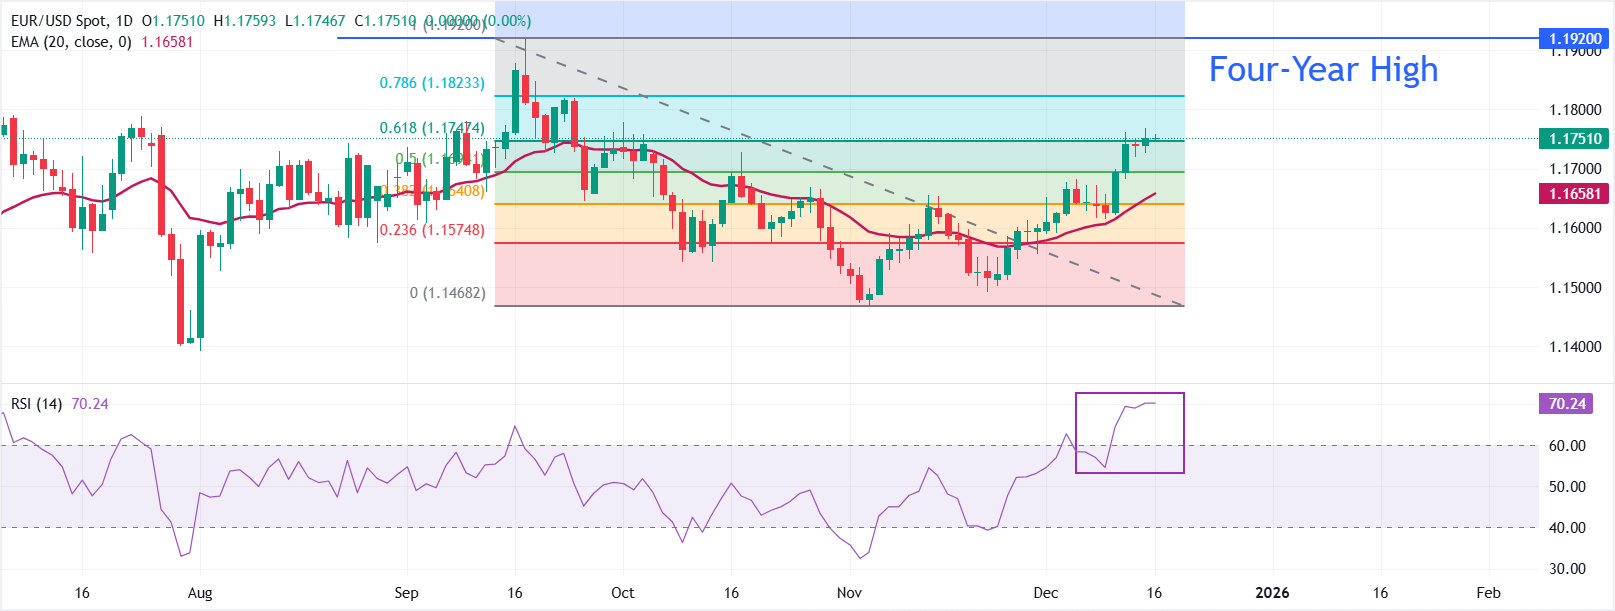
EUR/USD trades flat around 1.1750 as of writing ahead of the German/Eurozone PMI data. The 20-day Exponential Moving Average (EMA) at 1.1658 slopes higher and stays below the spot, keeping the short-term bias upward and offering initial support. A sustained hold above the 20-day EMA would preserve bullish momentum.

The 14-day Relative Strength Index (RSI) at 70.22 is near overbought levels, flagging stretched upside.

Measured from the 1.1920 high to the 1.1468 low, the stop wobbles around the 61.8% retracement at 1.1747. Going forward, a break above the same would unlock the 78.6% retracement at 1.1823. On setbacks, the rising 20-day EMA is expected to support the move. However, a close beneath it would soften the tone that might make it vulnerable towards the round-level figure of 1.1600.

(The technical analysis of this story was written with the help of an AI tool)

German economy FAQs

The German economy has a significant impact on the Euro due to its status as the largest economy within the Eurozone. Germany's economic performance, its GDP, employment, and inflation, can greatly influence the overall stability and confidence in the Euro. As Germany's economy strengthens, it can bolster the Euro's value, while the opposite is true if it weakens. Overall, the German economy plays a crucial role in shaping the Euro's strength and perception in global markets.

Germany is the largest economy in the Eurozone and therefore an influential actor in the region. During the Eurozone sovereign debt crisis in 2009-12, Germany was pivotal in setting up various stability funds to bail out debtor countries. It took a leadership role in the implementation of the 'Fiscal Compact' following the crisis – a set of more stringent rules to manage member states’ finances and punish ‘debt sinners’. Germany spearheaded a culture of ‘Financial Stability’ and the German economic model has been widely used as a blueprint for economic growth by fellow Eurozone members.

Bunds are bonds issued by the German government. Like all bonds they pay holders a regular interest payment, or coupon, followed by the full value of the loan, or principal, at maturity. Because Germany has the largest economy in the Eurozone, Bunds are used as a benchmark for other European government bonds. Long-term Bunds are viewed as a solid, risk-free investment as they are backed by the full faith and credit of the German nation. For this reason they are treated as a safe-haven by investors – gaining in value in times of crisis, whilst falling during periods of prosperity.

German Bund Yields measure the annual return an investor can expect from holding German government bonds, or Bunds. Like other bonds, Bunds pay holders interest at regular intervals, called the ‘coupon’, followed by the full value of the bond at maturity. Whilst the coupon is fixed, the Yield varies as it takes into account changes in the bond's price, and it is therefore considered a more accurate reflection of return. A decline in the bund's price raises the coupon as a percentage of the loan, resulting in a higher Yield and vice versa for a rise. This explains why Bund Yields move inversely to prices.

The Bundesbank is the central bank of Germany. It plays a key role in implementing monetary policy within Germany, and central banks in the region more broadly. Its goal is price stability, or keeping inflation low and predictable. It is responsible for ensuring the smooth operation of payment systems in Germany and participates in the oversight of financial institutions. The Bundesbank has a reputation for being conservative, prioritizing the fight against inflation over economic growth. It has been influential in the setup and policy of the European Central Bank (ECB).

Disclaimer: For information purposes only. Past performance is not indicative of future results.
placeholder
Gold Price Forecast: XAU/USD drifts higher above $4,200 as Fed delivers expected cutGold price (XAU/USD) gains momentum to around $4,235 during the early Asian session on Thursday. The precious metal extends its upside after the US Federal Reserve (Fed) delivered an expected third consecutive interest rate cut and maintained its outlook for just one cut in 2026.
Author  FXStreet
Dec 11, Thu
Gold price (XAU/USD) gains momentum to around $4,235 during the early Asian session on Thursday. The precious metal extends its upside after the US Federal Reserve (Fed) delivered an expected third consecutive interest rate cut and maintained its outlook for just one cut in 2026.
placeholder
Gold remains bid as lack of Fed clarity and geopolitical frictions persistGold (XAU/USD) advances modestly on Friday as traders seem to book profits ahead of the weekend, yet clings to gains of over 0.51% after reaching a seven-week high of $4,353. At the time of writing, XAU/USD trades at $4,302 as traders digest comments from Federal Reserve (Fed) officials.
Author  FXStreet
Yesterday 01: 34
Gold (XAU/USD) advances modestly on Friday as traders seem to book profits ahead of the weekend, yet clings to gains of over 0.51% after reaching a seven-week high of $4,353. At the time of writing, XAU/USD trades at $4,302 as traders digest comments from Federal Reserve (Fed) officials.
placeholder
Ethereum Price Slips Lower — $3,000 Looms as the Key BattlegroundEthereum is attempting to recover from a $3,026 low but remains below $3,200 and the 100-hour SMA, with a bearish trend line near $3,175 capping rebounds as bulls need a clean break above $3,200 to target $3,250–$3,400, while a drop below $3,050 risks a retest of $3,000 and $2,940.
Author  Mitrade
Yesterday 03: 25
Ethereum is attempting to recover from a $3,026 low but remains below $3,200 and the 100-hour SMA, with a bearish trend line near $3,175 capping rebounds as bulls need a clean break above $3,200 to target $3,250–$3,400, while a drop below $3,050 risks a retest of $3,000 and $2,940.
placeholder
Macro Analysts: Hawkish Japan Could Push Bitcoin Below $70KAnalysts predict Bitcoin may face further declines towards the $70,000 mark if the Bank of Japan raises interest rates as expected.
Author  Mitrade
Yesterday 05: 48
Analysts predict Bitcoin may face further declines towards the $70,000 mark if the Bank of Japan raises interest rates as expected.
placeholder
Bitcoin Slides 5% as Sellers Lean In — Can BTC Reclaim $88,000?Bitcoin has dropped back below $88,000 after rolling over from $90,500, with price still trading under the 100-hour Simple Moving Average. The sell-off found a floor at $85,151, and BTC is now consolidating near that base, but rebounds are facing pressure from a bearish trend line around $89,000. Bulls need to retake $88,000–$89,000 to ease downside risk; failure to do so keeps $85,500–$85,000 and then $83,500 in play, with $80,000 as the deeper “line in the sand.” Bitcoin (BTC) is back in damage-control mode after a sharp pullback wiped out recent gains. The price failed to reclaim the $90,000–$90,500 band, rolled over, and slid through $88,500 before briefly dipping under $87,000. Buyers did show up around $85,000, but the rebound so far looks more like stabilization than a clear trend reversal. Bitcoin dips hard, finds a bid near $85,000(h3) BTC’s latest move lower began when it couldn’t build follow-through above $90,000 and $90,500. Once that upside stalled, sellers took control and pushed price down through $88,500. The slide accelerated enough to spike below $87,000, but the market didn’t free-fall. Bulls defended the $85,000 zone, printing a low at $85,151. Since then, Bitcoin has been consolidating below the 23.6% Fibonacci retracement of the drop from the $93,560 swing high to the $85,151 low — a clue that the bounce is still shallow and that sellers haven’t fully backed off yet. Structurally, BTC is still on the back foot: It’s trading below $88,000, and It remains below the 100-hour Simple Moving Average, keeping short-term trend pressure pointed downward. Resistance is layered, and $89,000 is the problem area(h3) If bulls try to turn this into a recovery, they’ll have to climb through multiple ceilings in quick succession. First, BTC faces resistance around $87,150, followed by a more meaningful barrier near $87,500. From there, the market’s attention snaps back to $88,000 — the level BTC just lost and now needs to reclaim. A close back above $88,000 would improve the tone, but it doesn’t solve the bigger issue: there’s a bearish trend line on the hourly BTC/USD chart (Kraken feed) with resistance near $89,000, which also lines up with the next technical hurdle. If BTC can push through $89,000 and hold, the rebound could extend toward $90,000, with follow-through targets at $91,000 and $91,500. But until price clears that $88,000–$89,000 zone, rallies are at risk of being sold rather than chased. If BTC fails to reclaim resistance, the downside path is clear(h3) The near-term bear case is simple: if Bitcoin can’t climb back above the $87,000 area and keep traction, sellers may attempt another leg lower. Support levels line up like this: Immediate support: $85,500 First major support: $85,000 Next support: $83,500 Then $82,500 in the near term Below that, the major “don’t break this” level is still $80,000. If BTC slips under $80,000, the risk of acceleration to the downside increases significantly — not because it’s magic, but because it’s the kind of psychological and structural level that tends to trigger forced de-risking. Indicators: momentum still leans bearish(h3) The intraday indicators aren’t offering much comfort yet: Hourly MACD is losing pace in the bearish zone. Hourly RSI remains below 50, suggesting sellers still have the upper hand on short timeframes. So while the $85,000 defense held for now, the market hasn’t flipped bullish — it’s just stopped bleeding.
Author  Mitrade
6 hours ago
Bitcoin has dropped back below $88,000 after rolling over from $90,500, with price still trading under the 100-hour Simple Moving Average. The sell-off found a floor at $85,151, and BTC is now consolidating near that base, but rebounds are facing pressure from a bearish trend line around $89,000. Bulls need to retake $88,000–$89,000 to ease downside risk; failure to do so keeps $85,500–$85,000 and then $83,500 in play, with $80,000 as the deeper “line in the sand.” Bitcoin (BTC) is back in damage-control mode after a sharp pullback wiped out recent gains. The price failed to reclaim the $90,000–$90,500 band, rolled over, and slid through $88,500 before briefly dipping under $87,000. Buyers did show up around $85,000, but the rebound so far looks more like stabilization than a clear trend reversal. Bitcoin dips hard, finds a bid near $85,000(h3) BTC’s latest move lower began when it couldn’t build follow-through above $90,000 and $90,500. Once that upside stalled, sellers took control and pushed price down through $88,500. The slide accelerated enough to spike below $87,000, but the market didn’t free-fall. Bulls defended the $85,000 zone, printing a low at $85,151. Since then, Bitcoin has been consolidating below the 23.6% Fibonacci retracement of the drop from the $93,560 swing high to the $85,151 low — a clue that the bounce is still shallow and that sellers haven’t fully backed off yet. Structurally, BTC is still on the back foot: It’s trading below $88,000, and It remains below the 100-hour Simple Moving Average, keeping short-term trend pressure pointed downward. Resistance is layered, and $89,000 is the problem area(h3) If bulls try to turn this into a recovery, they’ll have to climb through multiple ceilings in quick succession. First, BTC faces resistance around $87,150, followed by a more meaningful barrier near $87,500. From there, the market’s attention snaps back to $88,000 — the level BTC just lost and now needs to reclaim. A close back above $88,000 would improve the tone, but it doesn’t solve the bigger issue: there’s a bearish trend line on the hourly BTC/USD chart (Kraken feed) with resistance near $89,000, which also lines up with the next technical hurdle. If BTC can push through $89,000 and hold, the rebound could extend toward $90,000, with follow-through targets at $91,000 and $91,500. But until price clears that $88,000–$89,000 zone, rallies are at risk of being sold rather than chased. If BTC fails to reclaim resistance, the downside path is clear(h3) The near-term bear case is simple: if Bitcoin can’t climb back above the $87,000 area and keep traction, sellers may attempt another leg lower. Support levels line up like this: Immediate support: $85,500 First major support: $85,000 Next support: $83,500 Then $82,500 in the near term Below that, the major “don’t break this” level is still $80,000. If BTC slips under $80,000, the risk of acceleration to the downside increases significantly — not because it’s magic, but because it’s the kind of psychological and structural level that tends to trigger forced de-risking. Indicators: momentum still leans bearish(h3) The intraday indicators aren’t offering much comfort yet: Hourly MACD is losing pace in the bearish zone. Hourly RSI remains below 50, suggesting sellers still have the upper hand on short timeframes. So while the $85,000 defense held for now, the market hasn’t flipped bullish — it’s just stopped bleeding.
goTop
quote