USD/CHF Price Analysis: Rising in a channel

Source Fxstreet
  • USD/CHF is trending higher within a rising channel. 
  • The trend is expected to continue to the next set of targets. 
  • A break below the lower channel line would be required to signal a reversal. 

USD/CHF is rallying in an ascending channel on the daily chart. It is in a short and medium-term uptrend which is expected to continue higher given the old adage that the “trend is your friend.” 

USD/CHF Daily Chart


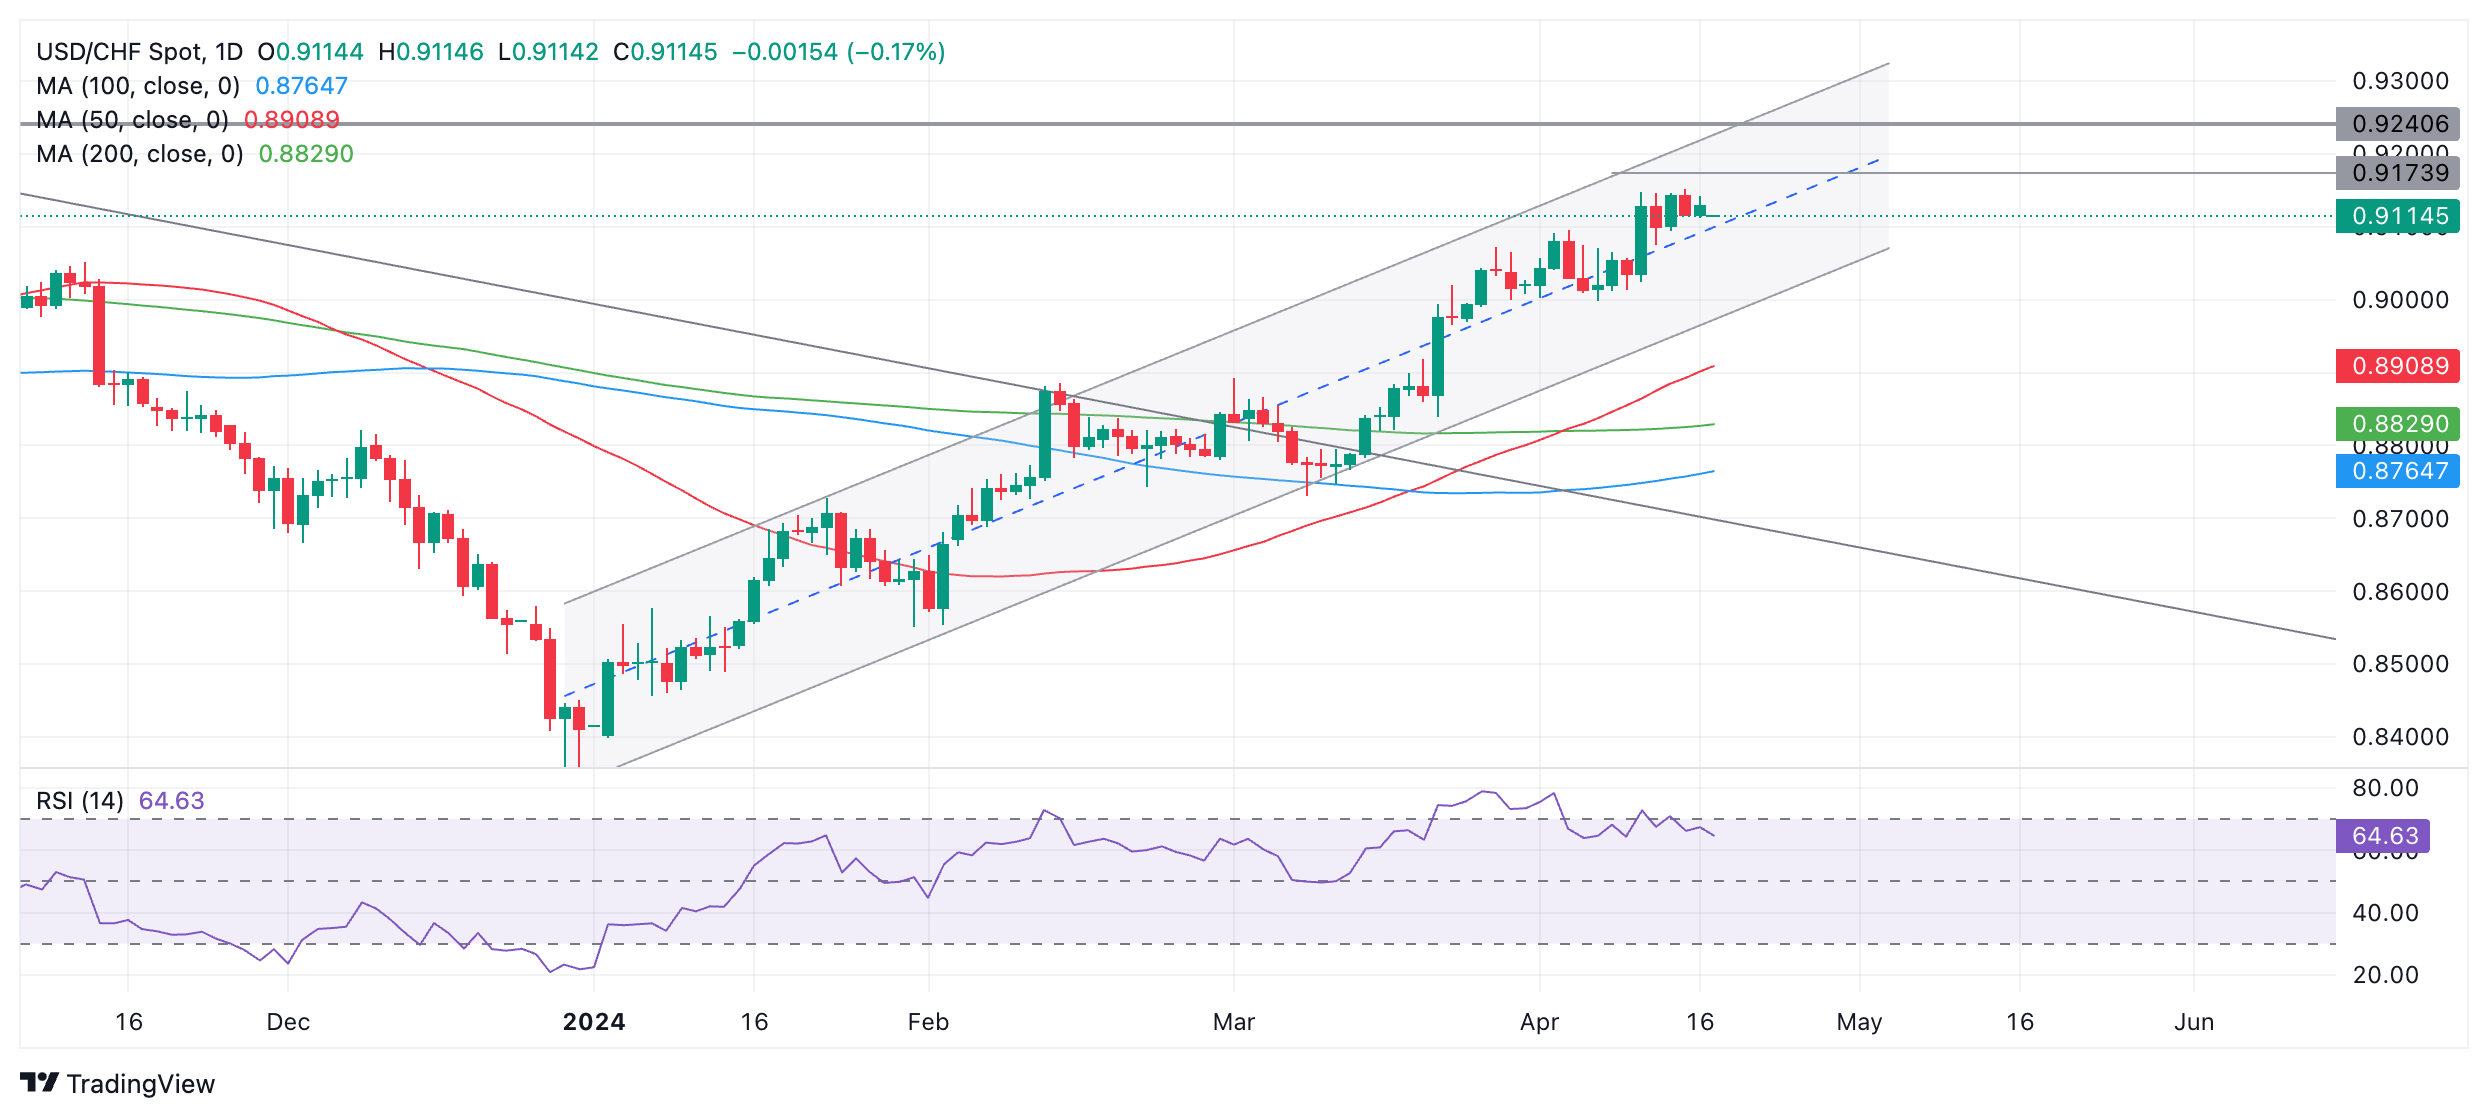
USD/CHF has been consolidating over the past few days in the lower 0.9100s but it will probably eventually break higher in accordance with the dominant uptrend. A break above the 0.9152 April highs would confirm more upside. 

The next target to the upside comes in at around 0.9173 where some major moving averages converge on higher time-frame charts. 

Following that, the next upside target would be located at 0.9240 the level of previous major swing highs made in October 2023.

The Relative Strength Index (RSI) is not overbought any longer, suggesting scope for further upside. 

A decisive break below the lower boundary of the channel, currently at roughly 0.9020, would reverse the outlook and bring into question the direction of the intermediate trend. 

A decisive break would be one characterized by a breach with a longer-than-average red candlestick or three consecutive red candlesticks. 


Disclaimer: For information purposes only. Past performance is not indicative of future results.
placeholder
What's Really Inside the AI Bubble? Decoding the Core Controversies Over Scale, Reliance and Valuation As ChatGPT nears its three-year anniversary, the AI boom has fueled a three-year U.S. equity rally. However, growing AI bubble concerns and investor fatigue now threaten to derail market
Author  TradingKey
8 hours ago
As ChatGPT nears its three-year anniversary, the AI boom has fueled a three-year U.S. equity rally. However, growing AI bubble concerns and investor fatigue now threaten to derail market
placeholder
Top 3 Price Prediction: Bitcoin, Ethereum, Ripple – BTC, ETH, and XRP flash deeper downside risks as market selloff intensifiesBitcoin (BTC), Ethereum (ETH) and Ripple (XRP) trade in red on Friday after correcting more than 5%, 10% and 2%, respectively, so far this week.
Author  FXStreet
10 hours ago
Bitcoin (BTC), Ethereum (ETH) and Ripple (XRP) trade in red on Friday after correcting more than 5%, 10% and 2%, respectively, so far this week.
placeholder
Gold Posts Biggest Weekly Gain in a Month as US Data Delays Fuel UncertaintyGold climbed higher on Friday, marking its strongest weekly performance in a month, as traders weighed the impact of a data backlog following the end of the US government's extended shutdown. Silver also moved upward.
Author  Mitrade
12 hours ago
Gold climbed higher on Friday, marking its strongest weekly performance in a month, as traders weighed the impact of a data backlog following the end of the US government's extended shutdown. Silver also moved upward.
placeholder
WTI rises to near $60.00 on supply risks due to US sanctionsWest Texas Intermediate (WTI) Oil price gains for the second successive session, trading around $59.90, up by more than 2%, during the Asian hours on Friday. Crude Oil prices receive support from supply risks linked to upcoming United States (US) sanctions.
Author  FXStreet
14 hours ago
West Texas Intermediate (WTI) Oil price gains for the second successive session, trading around $59.90, up by more than 2%, during the Asian hours on Friday. Crude Oil prices receive support from supply risks linked to upcoming United States (US) sanctions.
placeholder
Ethereum slides 5% as bears lean on $3,500 cap and put $3,150 support in focusEthereum (ETH) drops more than 5% after a failed push above $3,550, with price sliding to $3,153 and now holding below $3,350, the 100-hour SMA and a bearish trend line at $3,500; unless bulls reclaim the $3,350–$3,500 zone, the short-term bias stays bearish and a clean break under $3,150 could expose $3,050, $3,000 and even the $2,880–$2,850 support area.
Author  Mitrade
15 hours ago
Ethereum (ETH) drops more than 5% after a failed push above $3,550, with price sliding to $3,153 and now holding below $3,350, the 100-hour SMA and a bearish trend line at $3,500; unless bulls reclaim the $3,350–$3,500 zone, the short-term bias stays bearish and a clean break under $3,150 could expose $3,050, $3,000 and even the $2,880–$2,850 support area.
Related Instrument
goTop
quote