NZD/USD Price Analysis: Bearish dominance persists, signs of short-term bullish recovery detected

Source Fxstreet
  • The daily RSI of the NZD/USD reveals that sellers remain in command with values below 50.
  • The daily MACD shows a slowdown in selling pressure as flat green bars begin to form.
  • Buyers hint at gaining minor traction in the short term, with hourly indicators recovering.

The NZD/USD pair reflects the ongoing dominance of sellers, declining towards the 0.5935 mark. While signs of bearish control are evident, there is a clue of bullish resilience, hinting at a neutral to bearish outlook in the short term.

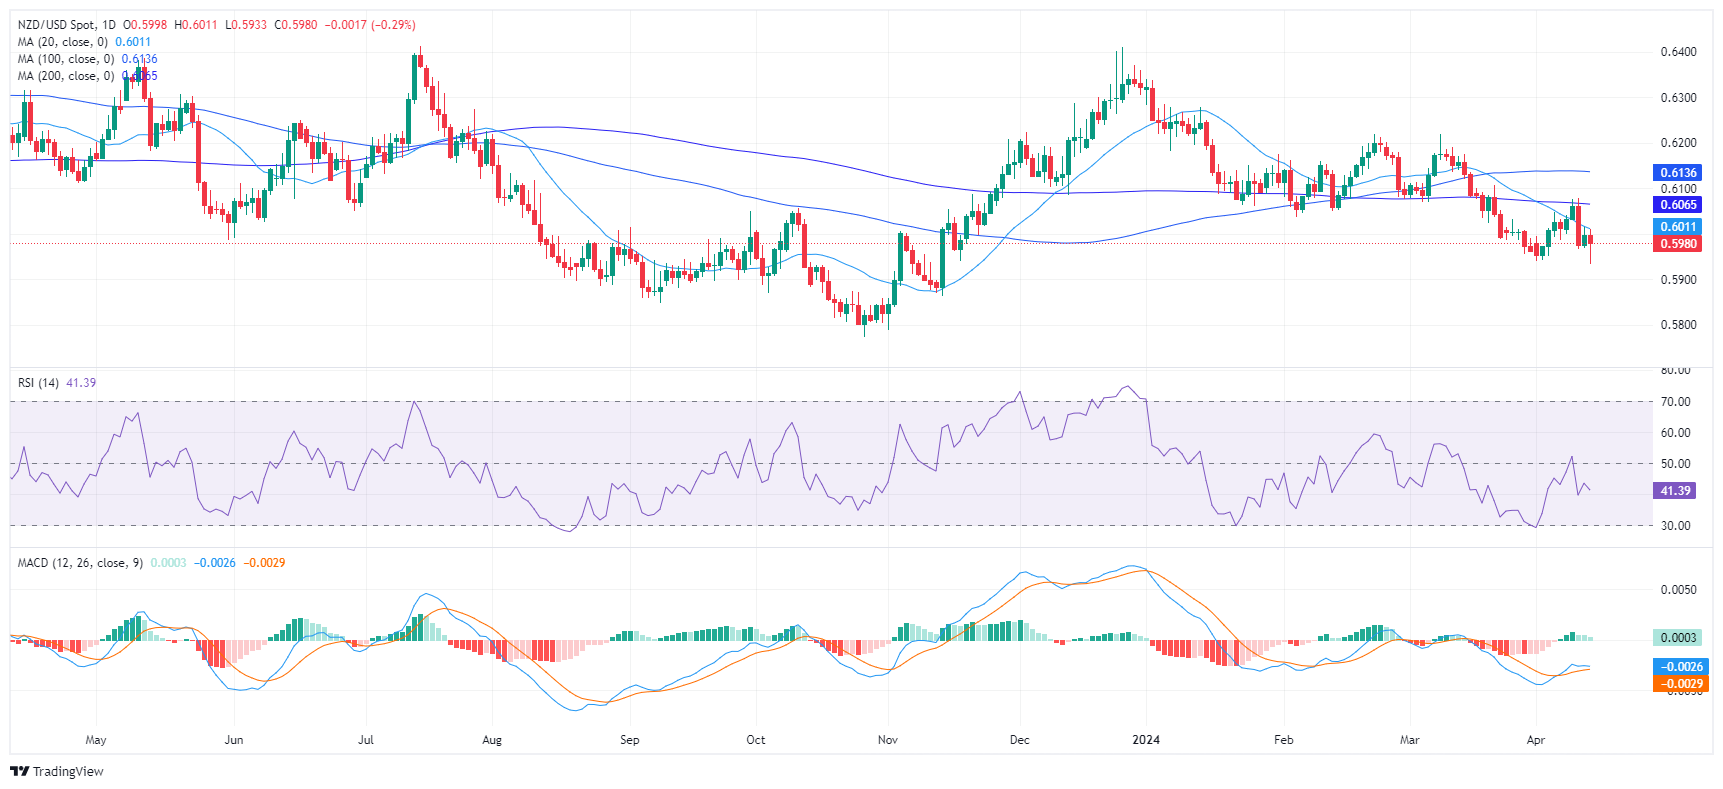
The daily  Relative Strength Index (RSI) maintains a consistent presence in the negative territory below 50, with the latest value at 38 which indicates that sellers are in command. That being said, green bars take shape on the Moving Average Convergence Divergence (MACD) histogram, indicating a slowing of the bearish momentum.

NZD/USD daily chart
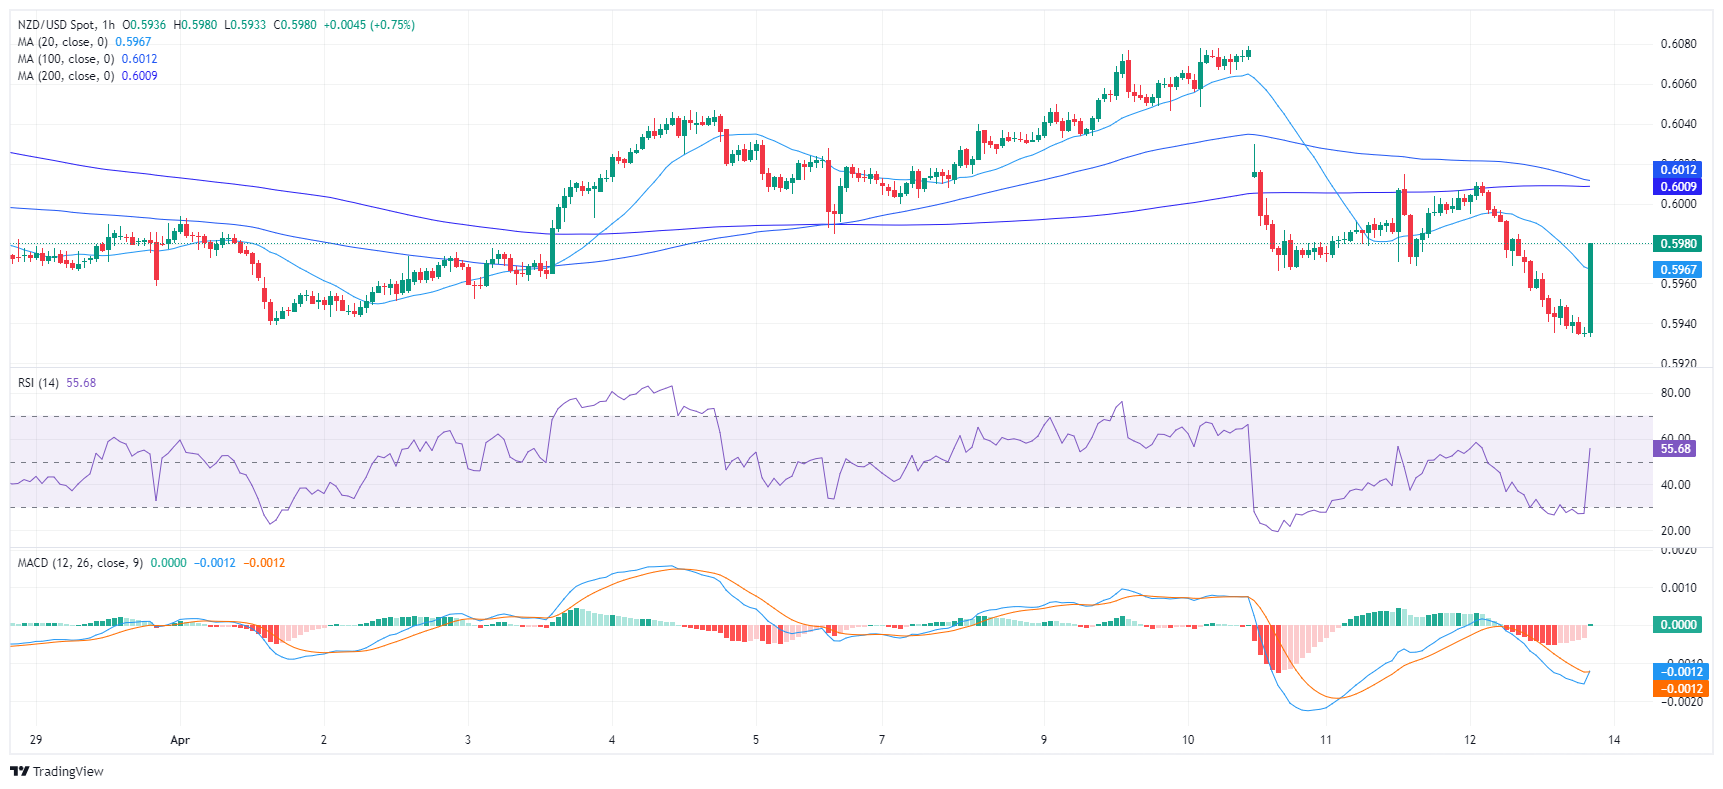
In contrast, the hourly chart indicates a gradually increasing RSI with the latest reading at 47. This suggests a mild recovery of buying interest after dropping into oversold conditions earlier in the session. Moreover, the MACD histogram shows a fresh green bar, implying a positive change in the short term momentum.

NZD/USD hourly chart
With respect to the broader trend, the outlook is bearish with the pair below the 20,100 and 200-day Simple Moving Averages (SMAs). However, the pair is close to its 20-day average and if buyers regain additional ground and recapture it, the outlook may start to shift in favor of the bulls.


NZD/USD

Overview
Today last price 0.598
Today Daily Change -0.0017
Today Daily Change % -0.28
Today daily open 0.5997
 
Trends
Daily SMA20 0.6016
Daily SMA50 0.6084
Daily SMA100 0.6137
Daily SMA200 0.6066
 
Levels
Previous Daily High 0.6015
Previous Daily Low 0.5969
Previous Weekly High 0.6047
Previous Weekly Low 0.5939
Previous Monthly High 0.6218
Previous Monthly Low 0.5956
Daily Fibonacci 38.2% 0.5997
Daily Fibonacci 61.8% 0.5987
Daily Pivot Point S1 0.5973
Daily Pivot Point S2 0.5948
Daily Pivot Point S3 0.5927
Daily Pivot Point R1 0.6019
Daily Pivot Point R2 0.604
Daily Pivot Point R3 0.6065


Disclaimer: For information purposes only. Past performance is not indicative of future results.
placeholder
Silver spikes up to $36.50 with markets turning cautiousSilver (XAG/USD) is extending its rebound from Monday’s lows at $35.40 to intra-day highs at $36.50.
Author  FXStreet
12 hours ago
Silver (XAG/USD) is extending its rebound from Monday’s lows at $35.40 to intra-day highs at $36.50.
placeholder
EUR/GBP keeps the red above mid-0.8500s after Eurozone inflation dataThe EUR/GBP cross retreats from the vicinity of the 0.8600 mark, or its highest level since April 23 touched earlier this Tuesday and sticks to modest intraday gains through the first half of the European session.
Author  FXStreet
12 hours ago
The EUR/GBP cross retreats from the vicinity of the 0.8600 mark, or its highest level since April 23 touched earlier this Tuesday and sticks to modest intraday gains through the first half of the European session.
placeholder
Dollar Endures Worst Half in Decades: What's Next for 2025?The dollar experienced its weakest first half in more than 50 years, hurt by geopolitical tensions and former President Donald Trump's trade policies.
Author  Insights
13 hours ago
The dollar experienced its weakest first half in more than 50 years, hurt by geopolitical tensions and former President Donald Trump's trade policies.
placeholder
XRP, ETH Traders Getting Greedy? Funding Rates Highest Among Top CoinsData shows XRP and Ethereum top the Funding Rate charts among the major cryptocurrencies, a sign of growing demand for long positions.
Author  Bitcoinist
13 hours ago
Data shows XRP and Ethereum top the Funding Rate charts among the major cryptocurrencies, a sign of growing demand for long positions.
placeholder
Bitcoin Price Forecast: BTC slips below $107,000 even as exchange reserves hit 6-year low Bitcoin (BTC) slips below $107,000 at the time of writing on Tuesday, continuing a mild pullback from the previous day.
Author  FXStreet
13 hours ago
Bitcoin (BTC) slips below $107,000 at the time of writing on Tuesday, continuing a mild pullback from the previous day.
Related Instrument
goTop
quote